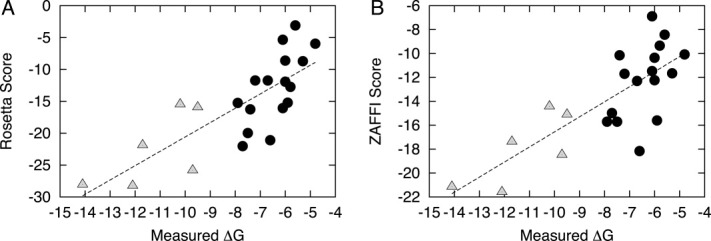
Figure 7.

Scores versus measured binding affinities for 22 TCR/pMHC complexes, using (A) Rosetta and (B) ZAFFI. The complexes include 17 structures from the TCR docking benchmark and five additional complexes of high affinity TCR mutants with antigens. Low and moderate affinity complexes (black circles) are distinguished from high affinity complexes (gray triangles). Best-fit lines are shown for each function; the correlation between scores and experimental measurements is 0.79 for both.
