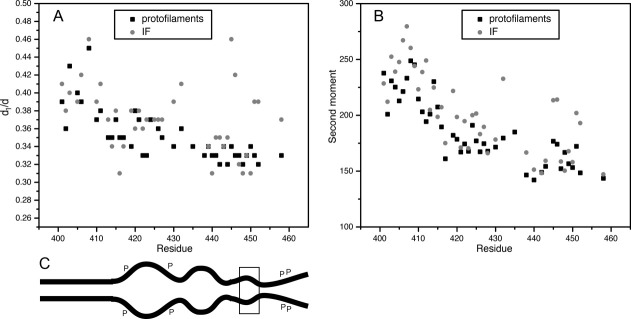
Figure 5.

Relative order throughout the tail domain of vimentin in the protofilament and filament states. A: Plot of the motion-independent line broadening (d1/d) versus sequence position for frozen vimentin (−100°C). B: The spectral breadth of samples at room-temperature calculated from the spectral second moments <H2> versus tail domain sequence position. Values for d1/d and <H2> data points, filament assembly and wild type amino acid identity are available in Supporting Information Table 1. C: Schematic of vimentin displaying the end of the rod domain and tail domain. The increase and decrease in distance between tails in a dimer is depicted, and correlates with the data in graph (A). “P” represents sites of phosphorylation, while the box encompasses the beta site.
