
Figure 1.
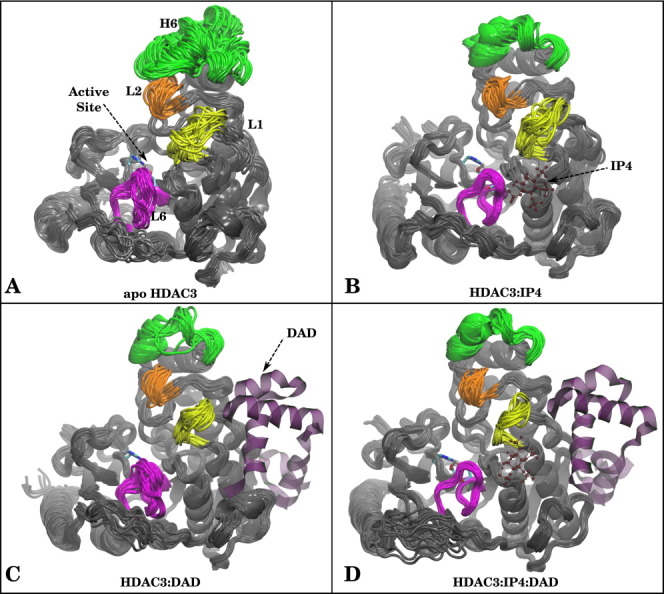
Superimposed snapshots from MD simulations for (A) apo HDAC3, (B) HDAC3:IP4, (C) HDAC3:DAD, and (D) HDAC3:IP4:DAD. Helix 6 (green), Loop1 (yellow), Loop2 (orange), and Loop 6 (magenta) are highlighted to show differences in dynamics. If present in the simulation, DAD and IP4 are shown as purple ribbons or red ball-and-stick representations, for reference. [Color figure can be viewed in the online issue, which is available at wileyonlinelibrary.com.]