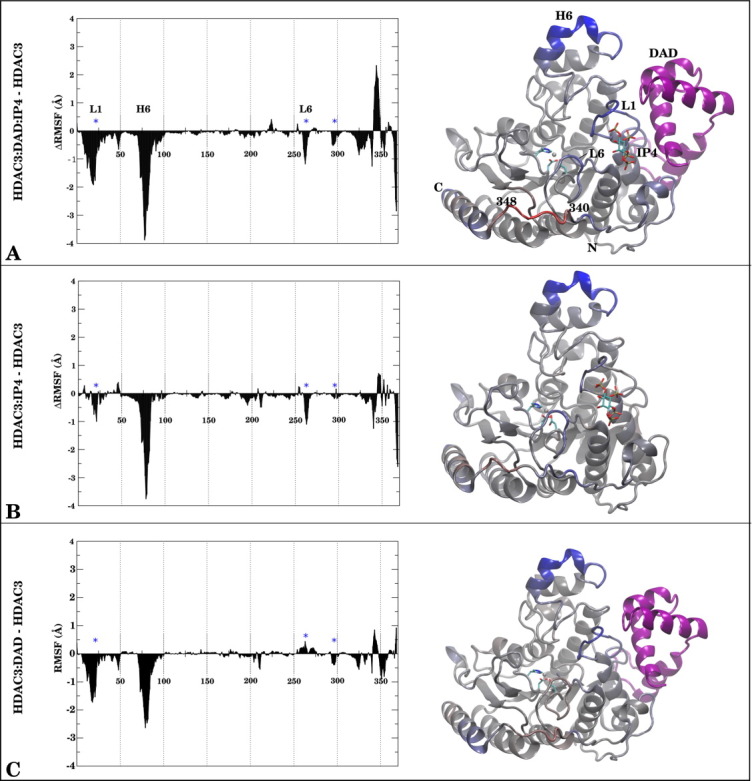
Figure 2.

The ΔRMSF (Å) per residue in HDAC3 between (A) HDAC3:DAD:IP4, (B) HDAC3:IP4, (C) HDAC3:DAD and the apo state is shown on the left side of each panel. The same values are projected onto a structure of the protein for reference, using a Blue (Negative)→Gray (Zero)→Red (Positive) scale. A range from −3.00 to +3.00 Å was used to make the figure. DAD and IP4, when present in the simulations are shown for reference in purple ribbons and stick representations, respectively.
