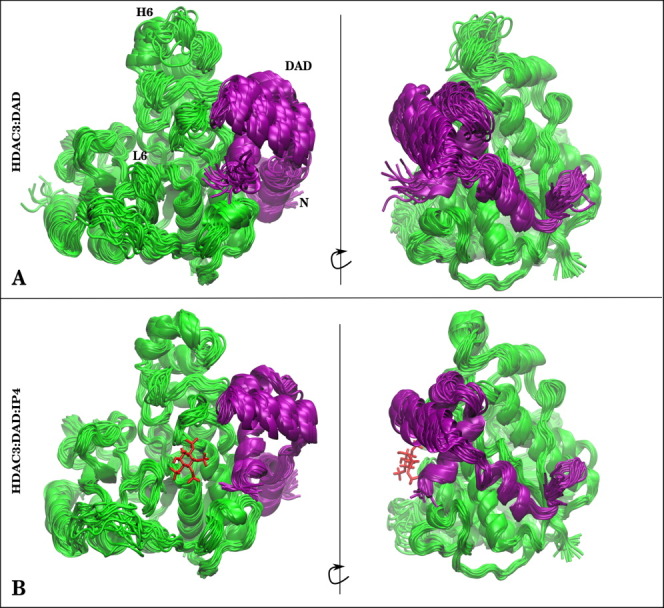
Figure 4.

Structures from (A) HDAC3:DAD and (B) HDAC3:DAD:IP4 simulations are presented to show difference in stabilities of the protein–protein complex owing to the presence of IP4. HDAC3 (green) is shown with the DAD domain (purple). If IP4 was present in the simulation, a single snapshot of IP4 is shown as red sticks for reference. [Color figure can be viewed in the online issue, which is available at wileyonlinelibrary.com.]
