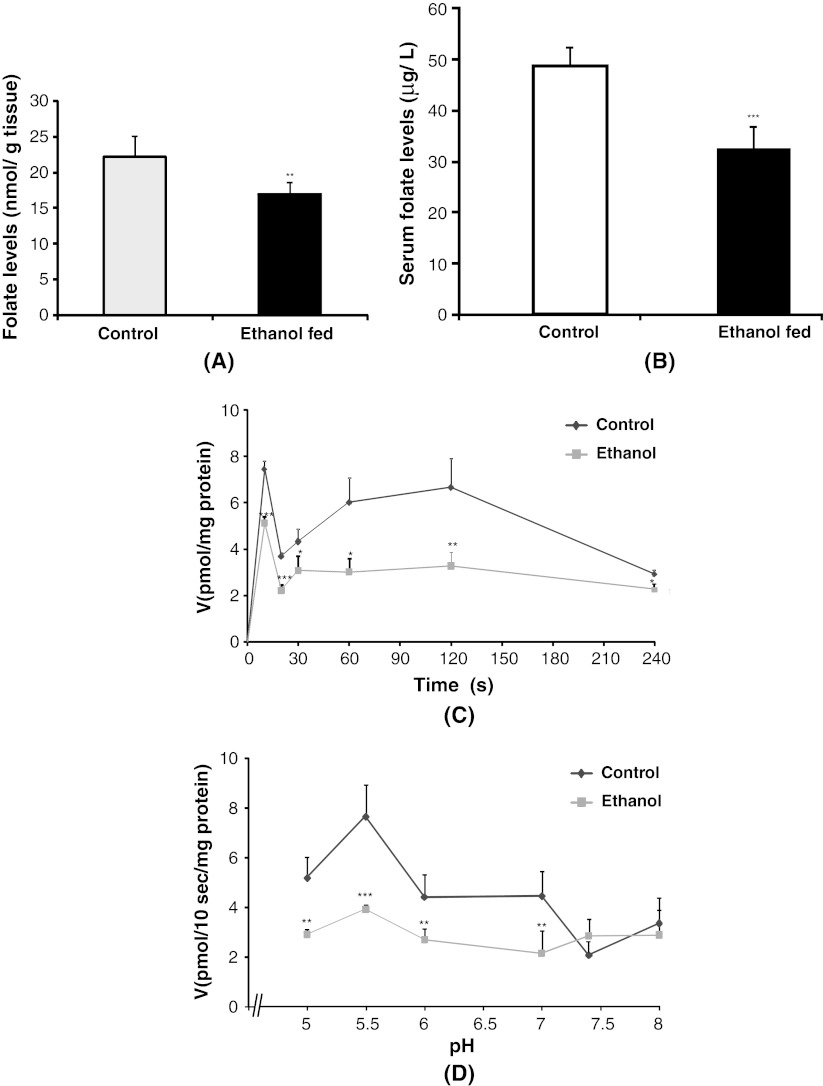
Fig. 1.
Folate levels and folate uptake as a function of time and pH. a Folate levels in liver of control and ethanol-fed rats. b Folate levels in serum of control and ethanol-fed rats estimated by microtitre plate assay using L. casei.c Time course of folate uptake in the liver basolateral membrane vesicles (BLMV). BLMV were incubated at 37 °C in buffer (100 mM NaCl, 80 mM mannitol, 10 mM HEPES, 10 mM 2-morpholinoethanesulfonic acid (MES) pH 5.5) for different time intervals. 5-[14C]-Methyl-THF (0.5 μM) was added to the incubation medium at the start of uptake. Each point represents the mean ± SD of four determinations. d Uptake of 5-[14C]-Methyl-THF in the rat liver BLMV as a function of pH optimum. Uptake was measured by varying the pH of incubation buffer [100 mM NaCl, 80 mM mannitol, 10 mM HEPES, 10 mM 2-morpholinoethanesulfonic acid (MES)] from 5.0 to 8.0, keeping intravesicular pH 7.4 at 0.5 μM substrate concentration for 10 s. Each data point is mean ± SD of 4 separate uptake determinations. *p < 0.05; **p < 0.01; ***p < 0.001 versus control

