
Figure 2.
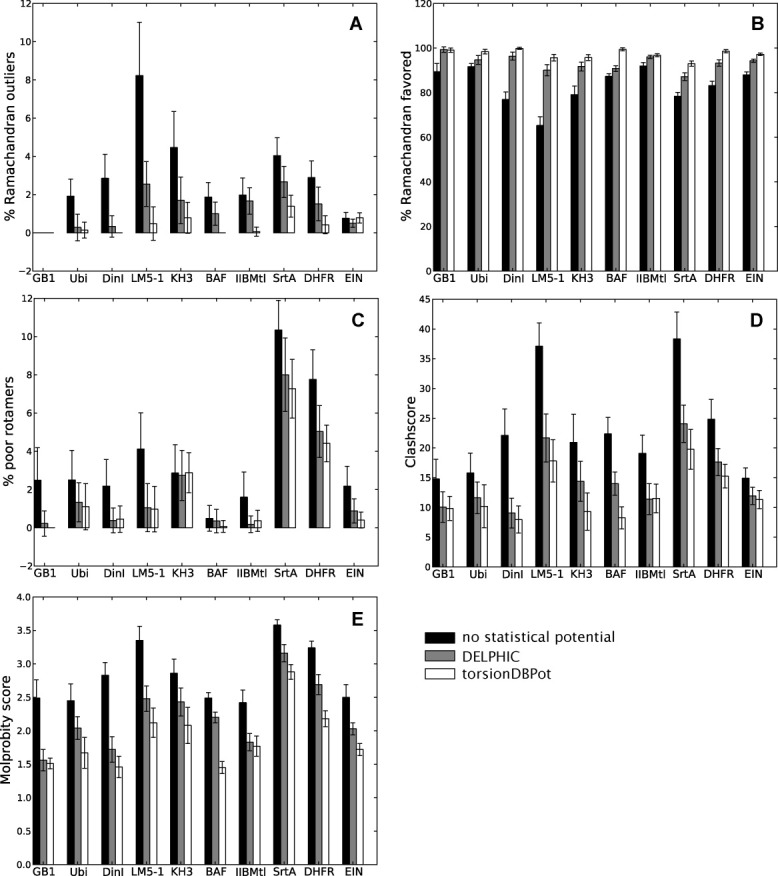
MolProbity validation. Each barplot displays a Molprobity validation statistic for structure ensembles of different proteins, with bars representing the mean ± standard deviation computed from 20 structures. Structure calculations without any statistical torsion angle potential (black), with the DELPHIC potential12 (gray), and with the new torsionDBPot potential (white) are included. Abbreviated protein names are used; for full names see Table II. The clashscore36 (panel D) and the MolProbity score18 (panel E) are costs: the lower the better. Barplots in this and all other figures were generated with Matplotlib.23