
Figure 3.
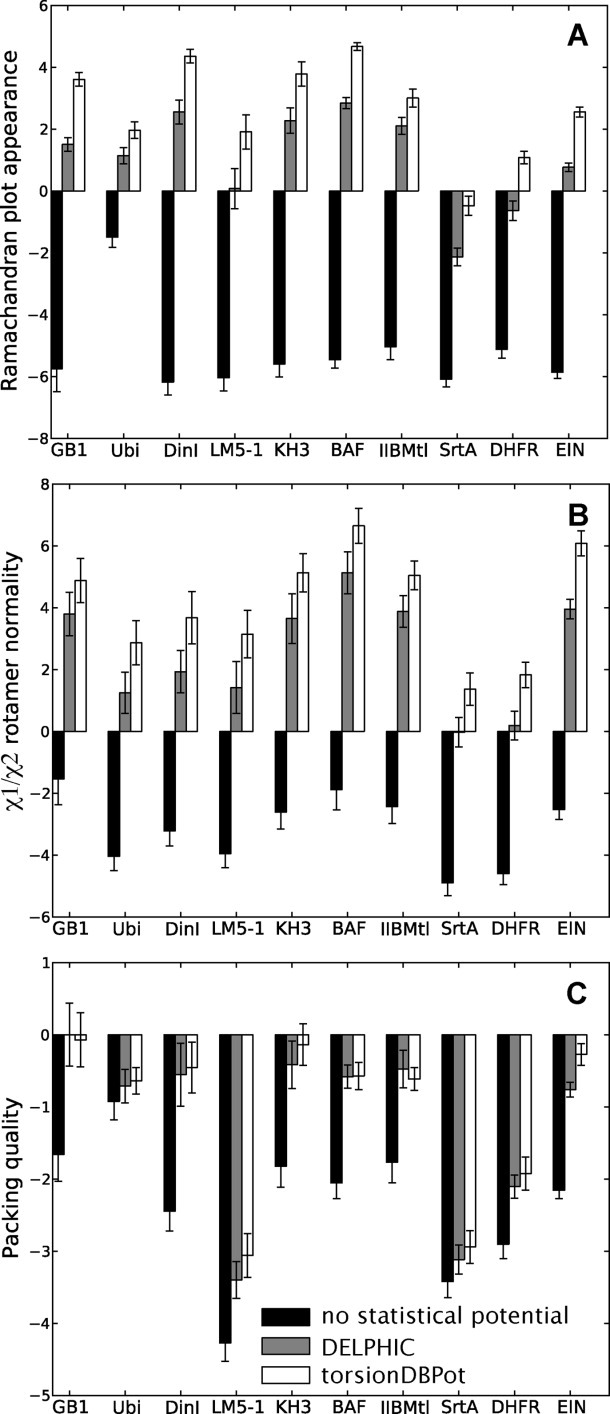
WHAT IF validation. Each barplot displays a WHAT IF validation statistic for structure ensembles of different proteins, with bars representing the mean ± standard deviation computed from 20 structures. Structure calculations without any statistical torsion angle potential (black), with the DELPHIC potential12 (gray), and with the new torsionDBPot potential (white) are included. Abbreviated protein names are used; for full names see Table II. Each statistic is a score: the larger the better. Packing quality (panel C) refers to the 2nd generation packing quality.