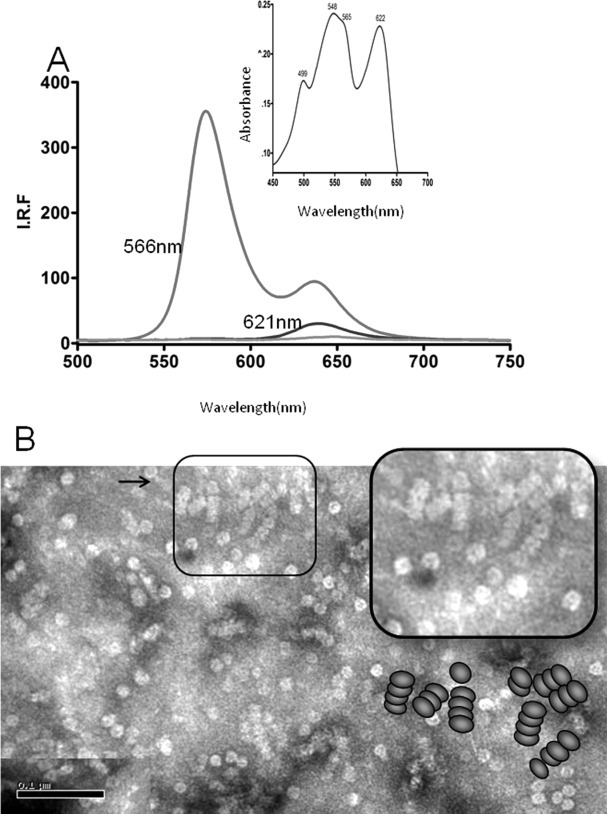
Figure 2.

Characterization of rod-enriched fractions. A: Fluorescence spectrum upon excitation at 566 and 621 nm as indicated. B: Electron micrograph of the rod-enriched fraction. An enhancement of the image is shown in the insert, and the schematic representation on that region of the image.
