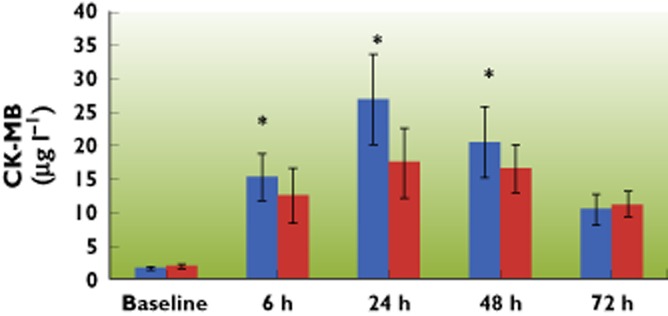
Figure 3.

Serial changes following CPB in cardiac CK‐MB concentrations in arterial blood of patients over a 72 h period. CK‐MB increased following CPB in both groups, but the increase in the parecoxib group was lower. Peak serum concentrations of CK‐MB in both groups occurred at 24 h post‐CPB. Data are shown as means ± SD, *P < 0.05 vs. control group.  : control group;
  : parecoxib group
