
Figure 1.
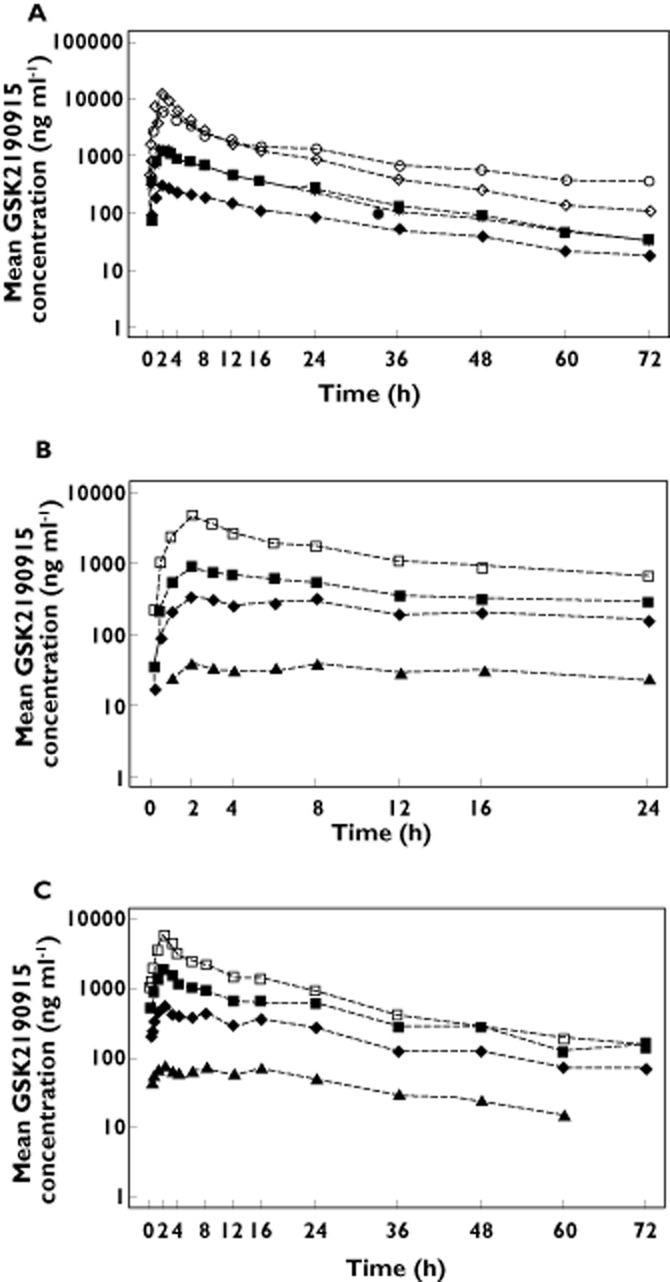
Pharmacokineticsof GSK2190915. Mean plasma concentration vs. time profiles for GSK2190915 in healthy Western European subjects on (A) day 1 after single dose administration of 50 mg, ( ), 150 mg (
 ), 300 mg (
 ), 600 mg (
 ) or 1000 (
 ) mg. Mean plasma concentration vs. time profiles for GSK2190915 in healthy Western European subjects on (B) day 1 or (C) day 11 following multiple dose administration of 10 mg (
 ), 50 mg, (
 ), 150 mg (
 ) or 450 mg (
 ).
).