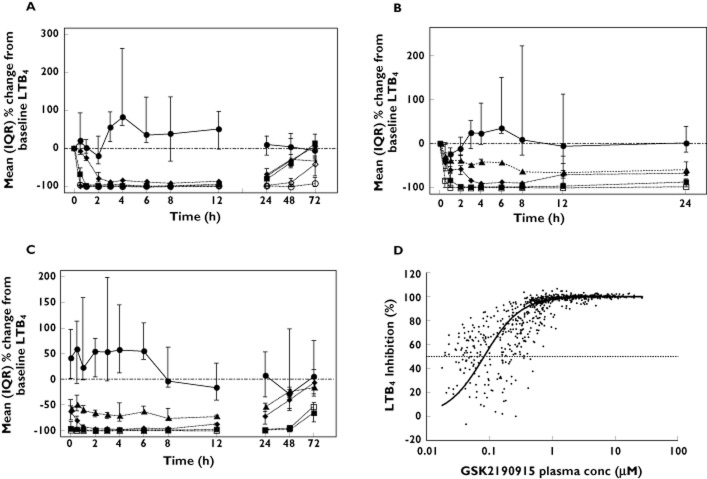
Figure 2.
LTB4 synthesis in ex vivo calcium ionophore‐challenged blood from Western European subjects. Median (plus interquartile range) percentage changes from baseline LTB4 in (A) the single dose study following placebo ( ) or 50 mg (
 ), 150 mg (
 ), 300 mg (
 ), 600 mg (
 ) or 1000 mg (
 ) GSK2190915. Median (plus interquartile range) percentage changes from baseline LTB4 on (B) day 1 or (C) day 11 following multiple dose administration of placebo (
 ) or 10 mg (
 ), 50 mg, (
 ), 150 mg (
 ) or 450 mg (
 ) GSK2190915. (D) Percent inhibition of LTB4 synthesis ex vivo in blood vs. plasma concentration. Included are the data from all dosed subjects in the single dose and multiple dose studies with measurable concentrations of GSK2190915. The EC50 and EC90 values of 85 nm and 360 nm, respectively, were generated from a non‐linear regression analysis of the data.

