
Figure 3.
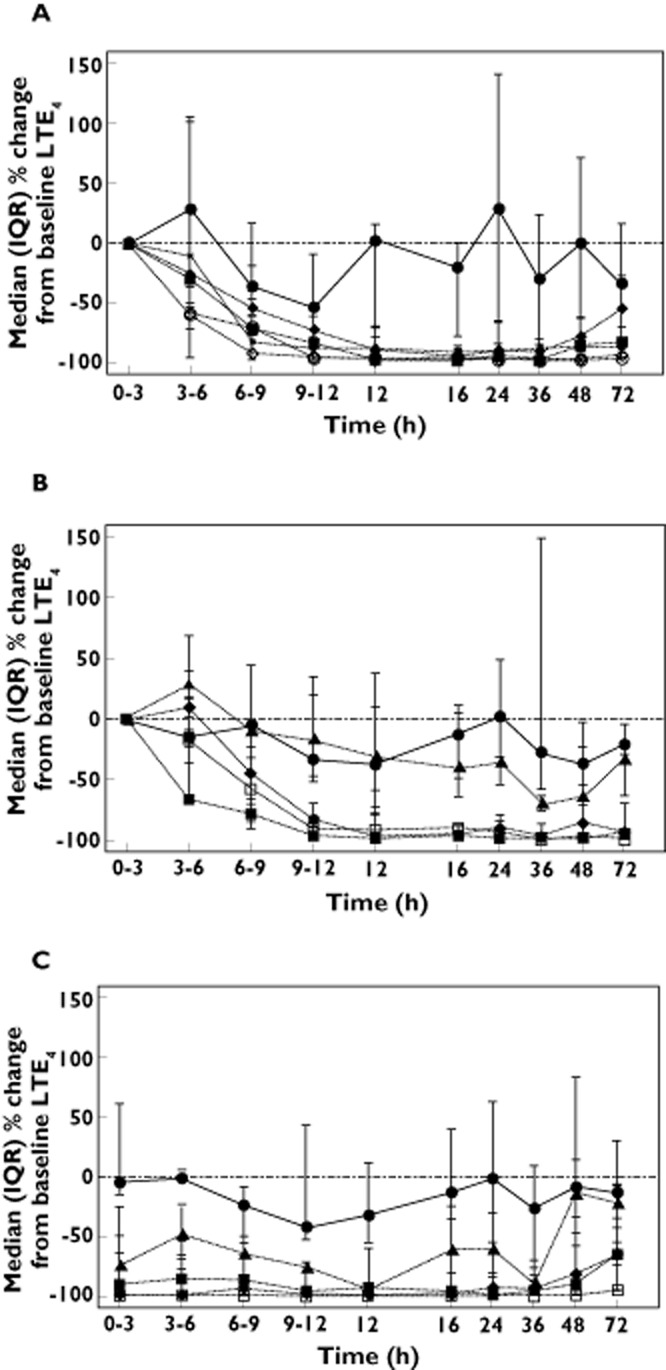
UrinaryLTE4 excretion in Western European subjects. Median (plus interquartile range) of LTE4 excretion in urine as a percentage of the pre‐dose value in (A) the single dose study following placebo ( ) or 50 mg (
 ), 150 mg (
 ), 300 mg (
 ), 600 mg (
 ) or 1000 mg (
 ) GSK2190915. Median (plus interquartile range) of LTE4 excretion in urine as a percentage of the pre‐dose value on (B) day 1 or (C) day 11 following multiple dose administration of placebo (
 ) or 10 mg (
 ), 50 mg, (
 ), 150 mg (
 ) or 450 mg (
 ) GSK2190915.