
Figure 4.
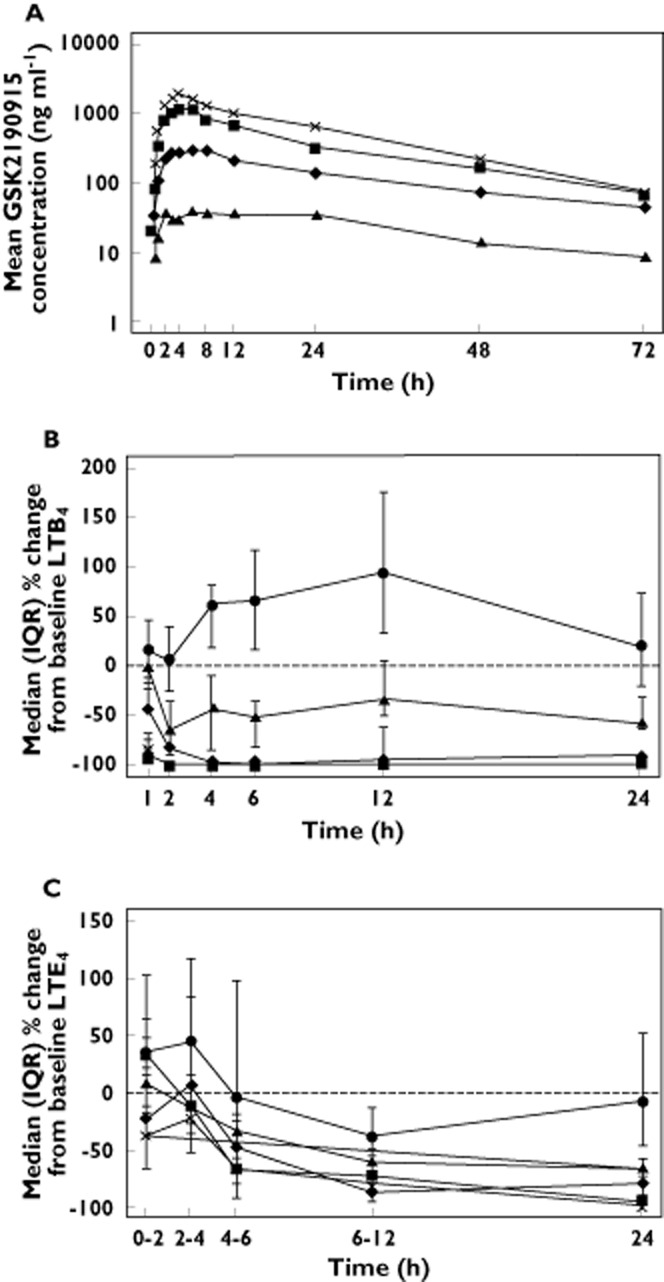
Pharmacokineticsand pharmacodynamics of GSK2190915 in healthy Japanese subjects. (a) Mean plasma concentration vs. time profiles for GSK2190915 following single dose administration of 10 mg ( ), 50 mg (
 ), 150 mg (
 ) or 200 mg (
 ) GSK2190915. (B) Median (plus interquartile range) percentage changes from baseline plasma LTB4 following single dose administration of placebo (
 ) or 10 mg (
 ), 50 mg (
 ), 150 mg (
 ) or 200 mg (
 ) GSK2190915. (C) Median (plus interquartile range) of LTE4 excretion in urine as a percentage of the pre‐dose value following single dose administration of placebo (
 ) or 10 mg (
 ), 50 mg (
 ), 150 mg (
 ) or 200 mg (
 ) GSK2190915.