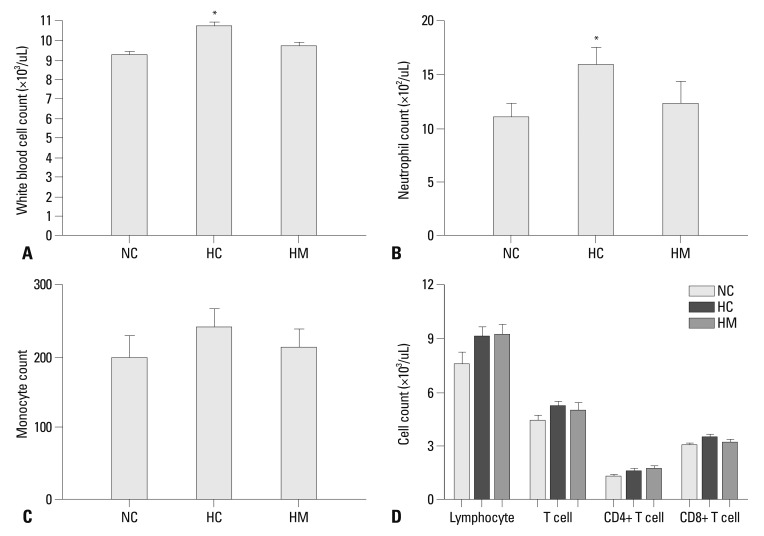
Fig. 5.
The number of white blood cells (WBC) (A), neutrophil (B), monocyte (C), and the number of lymphocyte with T cell (CD4 positive and CD8 positive T cell) (D) in each experimental group at P70. Although WBC counts were significantly increased in HC compared to NC, there were no significant differences in lymphocyte counts and subset between the experimental groups. Data are expressed as mean±SEM; *p<0.05 versus NC. NC, normoxia control group; HC, hyperoxia control group; HM, hyperoxia with human UCB-derived MSCs transplantation group; MSCs, mesenchymal stem cells; SEM, standard error of the mean.

