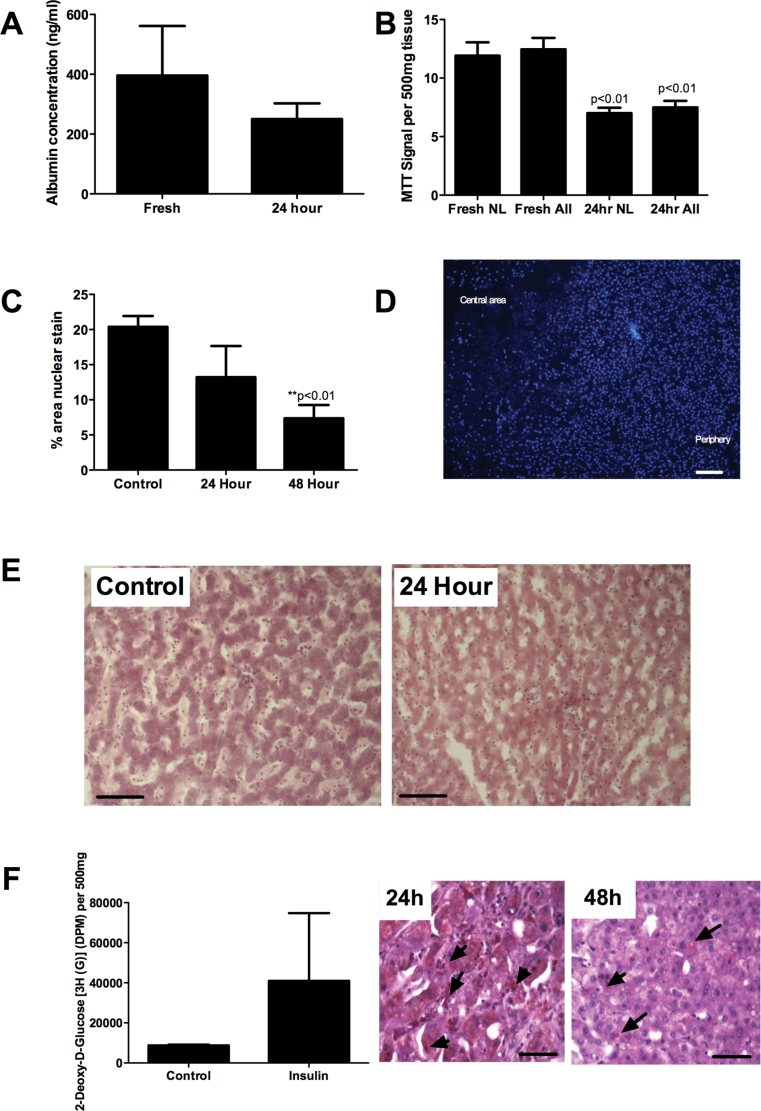
FIG. 1.
(A) Production of albumin by cultured liver slices (six representative slices from three different liver specimens) measured by capture ELISA. Paired t-test showed no significant difference between control and 24h incubations (p = 0.4). (B) MTT reduction assay using between 40 and 56 replicate slices from normal and resection margin tissue only (NL) or all liver (ALL) slices, which included slices from five end-stage cirrhotic specimens. Paired t-test showed no significant difference between signal from normal livers and all livers and a significant reduction in signal at 24h compared with control. Data represent signal normalized per 500mg of tissue ± SEM for triplicate slices from each liver. (C) Image J quantification of images from representative fields of view captured from normal sections stained using bisbenzimide to visualize nuclear integrity. Data represent mean ± SEM% of area stained positive in five HPF analyzed for duplicate slices from four liver samples. Paired t-test revealed significant reduction in nuclear number at 48h. (D) Representative image from stained normal liver after 48h in culture showing loss in nuclear integrity in central area of slice compared with periphery. Bar represents 100 µm. (E) Representative images showing gross morphology of parenchymal areas of sections cut from PCLS collected fresh (Control) or cultured in a well for 24h (24 Hour) stained using hematoxylin and eosin (original magnification ×200, bar represents 50 µm). (F) Uptake of radiolabeled glucose in response to insulin treatment of normal PCLS. Data represent mean ± SEM uptake of six replicate slices (left graph) and periodic acid-Schiff stain of sections from representative PCLS confirming the presence of glycogen granules after 24 and 48h in culture (right figures). Glycogen stains a reddish purple (see samples indicated by arrowheads), and bar represents 50 µm.

