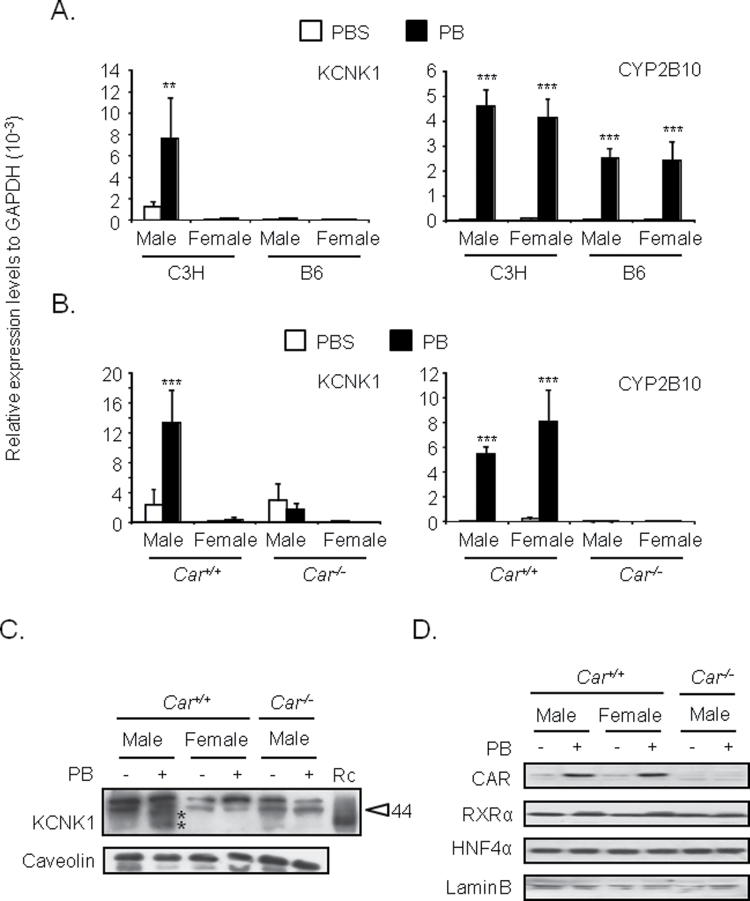
FIG. 1.
Male-specific induction of KCNK1 in mouse livers by phenobarbital.
Total RNAs, cell membrane fractions, and nuclear extracts were prepared from mouse livers as described in Materials and Methods section. (A and B) Expression levels of KCNK1 and CYP2B10 mRNA were determined. Values are expressed as the relative expression levels normalized to the expression levels of GAPDH mRNA. Data are mean ± SD (n = 3 or 4 in each group). **p < 0.01, ***p < 0.005 for PBS-treated mice vs. PB-treated mice, Tukey’s multiple comparison test. C3H, B6, and PB denote C3H/HeNCrlBR, C57BL/6, and phenobarbital, respectively. (C) Protein levels of KCNK1 in cell membrane fractions were determined. Protein levels of caveolin were determined as internal control. Data shown are representative of results from two to three individual experiments. The sizes of molecular markers (44kDa) are indicated as arrowhead. * represents putative molecular size of KCNK1 protein. Rc and PB denote bacterially expressed recombinant KCNK1 and phenobarbital. (D) Protein levels of CAR and RXRα in nuclear extracts were determined. Protein levels of laminB were determined as internal control. Data shown are representative of results from two to three individual experiments. PB = phenobarbital.

