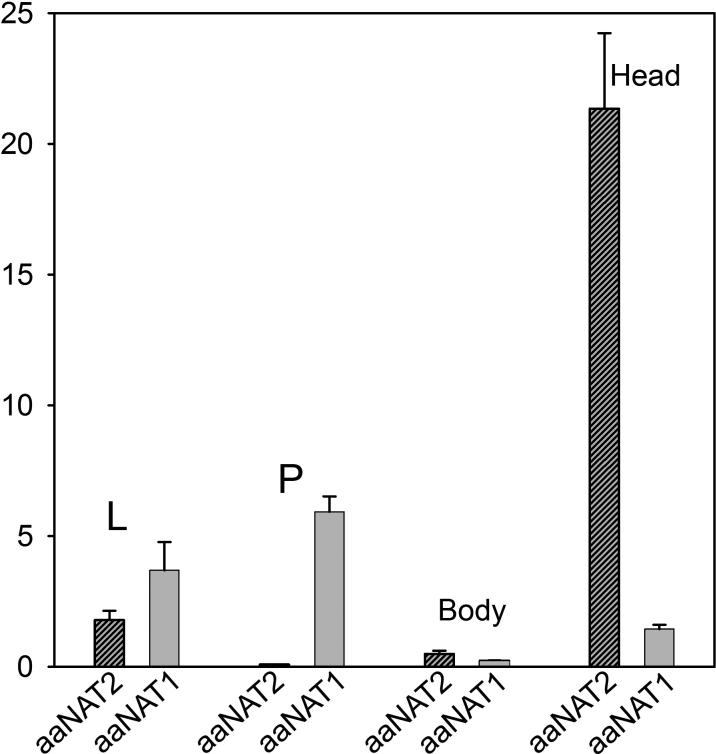
Figure 5.
Relative quantification of transcription of aaNAT1 and 2 by qRT-PCR. X-axis shows developmental stages and tissues examined, while Y-axis shows the relative transcript quantity compared with the Ae-rpS7 gene. Panels A and B represent transcription of aaNAT1 and 2, respectively. L: Three day old larvae, P: Pupae, Body: Female adult body, Head: Female adult head.

