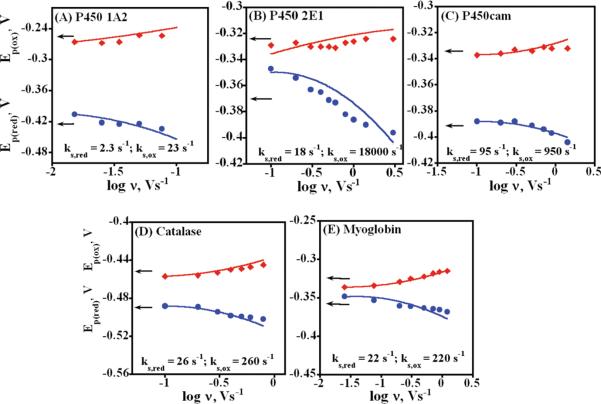
Figure 6.
Trumpet plots showing the influence of scan rate on CV peak potentials in anaerobic pH 7.0 buffer. Experimental oxidation (red diamonds) and reduction (blue circles) peak potentials are shown for (A) PEI(/PSS/P450 1A2)4, (B) PEI(/PSS/P450 2E1)4, (C) PSS(/PEI/P450cam)4, (D) PSS(/PEI/catalase)4, and (E) PEI(/PSS/myoglobin)4 films. The lines were obtained by best fit simulations using an Ereduction/Eoxidation mechanism using the reduction and oxidation rate constants shown in each plot.

