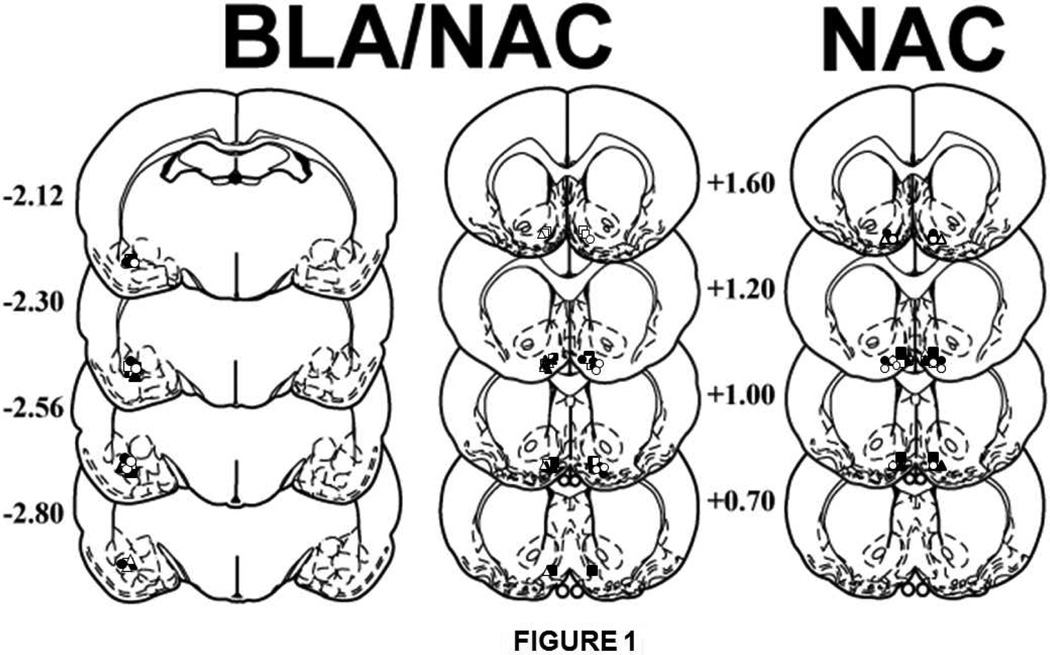
Figure 1.
Schematic representation of injection cannula placements. The symbols on the schematics (Paxinos and Watson, 1997) represent the most ventral point of the infusion cannula tracts for rats that received bilateral microinfusions into the NAC for experiment 1 (saline/home cage: closed squares; saline/heroin-paired context: open squares; AP-5/home cage, closed triangles; AP-5/heroin-paired context, open triangles; CNQX/home cage, closed circles; CNQX/heroin-paired context, open circles). For experiment 2, symbols represent the most ventral point of the infusion tract for rats receiving unilateral microinfusions into the BLA plus the contralateral NAC (home cage, closed circles; heroin-paired context, open circles) or the ipsilateral NAC (home cage, closed triangles; heroin-paired context, open triangles), or a control microinfusion of saline into the BLA and NAC (home cage, closed squares; heroin-paired context: open squares). Numbers indicate the distance from bregma in millimeters.

