
Figure 3. PrPC Vesicular Transport is Inhibited in Kinesin Light Chain Mutant Axons.
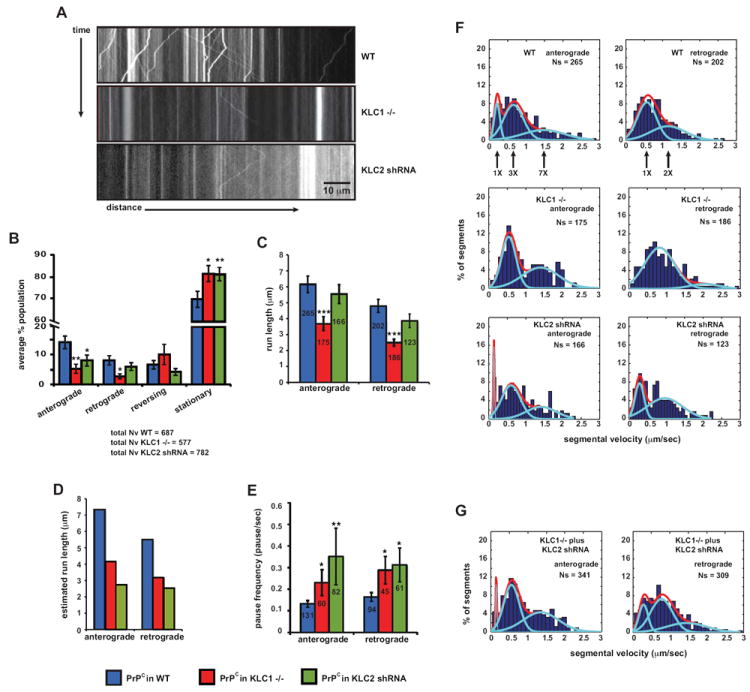
(A) Representative kymograph of YFP-PrPC vesicle movement in wild-type (top panel), KLC1 -/- (middle panel), and KLC2 shRNA (bottom panel) hippocampal axons.
(B-E) Transport parameters in KLC1 -/- and KLC2 shRNA axons. (B) Population breakdown of YFP-PrPC vesicles (Nv = # vesicles), (C) run length, (D) estimated run length, and (E) pause frequency. Numbers inside bars are segments (run length in C), and tracks (pause frequency in E). All values are shown as mean ± SEM. ***p<0.001, **p<0.01, *p<0.05, permutation t-test.
(F) Segmental velocity histograms (shown in percent of segments) in wild-type, KLC1 -/-, and KLC2 shRNA axons. Red and light blue curves represent the overall and predicted Gaussian modes, respectively.
(G) Anterograde and retrograde wild-type segmental velocity histograms (shown as percent of segments) were reconstituted from adding together histograms of KLC1 -/- and KLC2 shRNA axons (in F).
See also Figure S3.