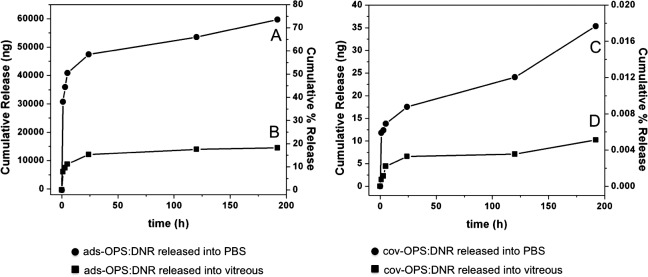
Figure 7. .

Left panel: Daunorubicin released ex vivo from ads-OPS:DNR (oxidized porous silicon particles containing physically adsorbed daunorubicin) into PBS (A) and into vitreous (B). Right panel: Daunorubicin released ex vivo from cov-OPS:DNR (oxidized porous silicon particles containing daunorubicin covalently attached to the pore walls) into PBS (C) and into vitreous (D). In each graph, the left y-axis represents cumulative amount of drug released over time, and the right y-axis represents cumulative percentage of drug released.
