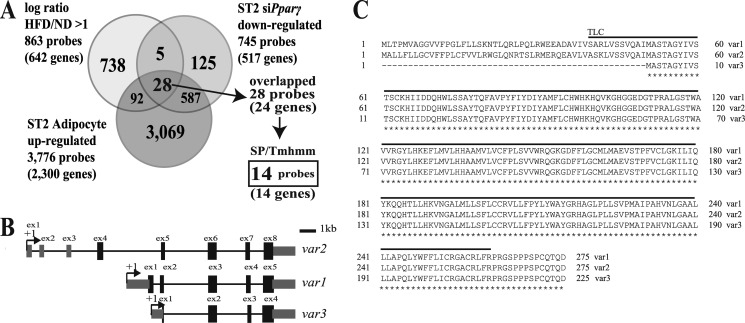
FIGURE 1.
Screening of PPARγ target genes that regulate metabolic disease. A, we performed an expression analysis of genes under the following three conditions: 1) genes that were up-regulated more than 2-fold in adipose tissue from mice that were fed a high fat diet (HFD) compared with a normal diet as a control (ND), 2) genes up-regulated in ST2 cells that had undergone adipogenesis, and 3) genes down-regulated in ST2 cells that had been treated with siRNA targeting Pparγ and undergone adipogenesis. The number in the Venn diagram represents the number of probes on the microarray. There were 14 common genes that contained a signal sequence and/or transmembrane region (which was screened with the signal peptide (SP) and transmembrane hidden Marcov method (Tmhmm) programs) as shown in Table 5. B, the structures of three variants of the Fam57b gene. The last four exons are common exons in these three variants. +1, transcription start site. C, the common amino acid sequence of the three FAM57B variants is indicated with a star below each amino acid, in which the lined amino acid sequence indicates the TLC domain. The sequences were obtained from the NCBI Web site.

