FIGURE 7.
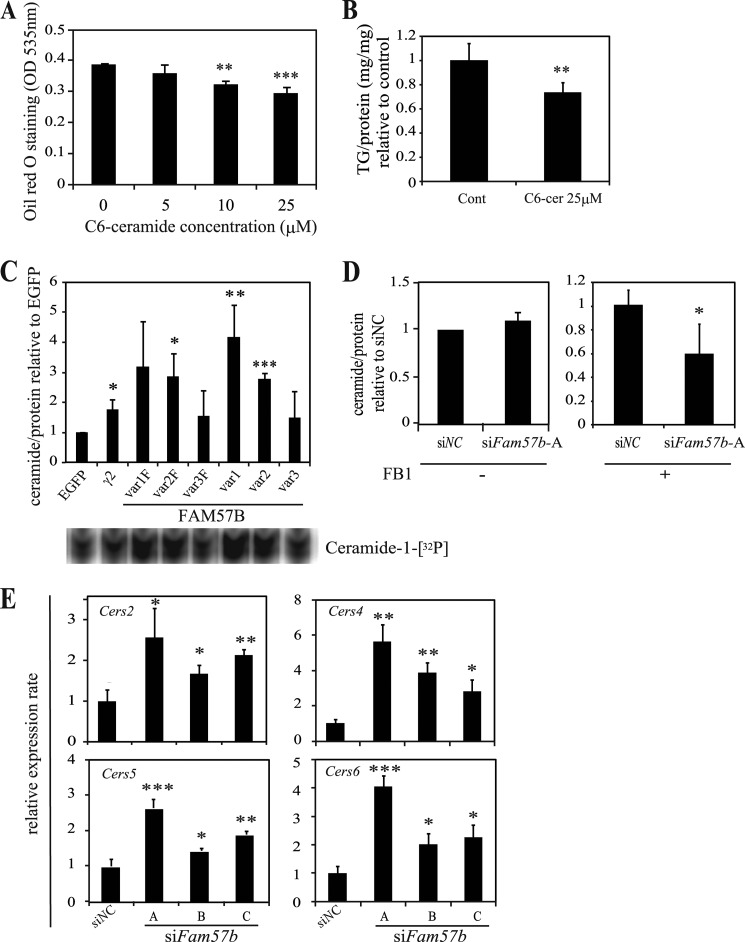
Total ceramide content is augmented in ST2 cells overexpressing FAM57B. A, ST2 cells were treated with the indicated concentration of C6-ceramide during adipogenesis and then stained with Oil Red O on day 6 of differentiation. The Oil Red O that accumulated in lipid droplets was extracted with isopropyl alcohol and measured at OD 535 nm. B, the triglyceride content was measured on day 6 of adipogenesis and is presented as the triglyceride levels normalized to the protein levels and the control. C, ST2 cells overexpressing each FAM57B variant with (var1F–var3F) and without FLAG (var1–var3) were differentiated into adipocytes for 6 days. Total lipids were extracted from cell lysates containing 200 μg of protein and subjected to the diacylglycerol kinase assay that enzymatically phosphorylates and labels lipids with 32P (Ceramide-1-[32P]), as described under “Experimental Procedures.” The samples were spotted onto thin layer chromatography plates and developed in organic solvents (bottom panel). The ceramide levels were digitized by measuring the band intensity with an Image analyzer (Image Gauge version 3.4, FUJIFILM), normalized to the protein levels, and then expressed relative to the control (EGFP-expressing cells). γ2 represents the ceramide levels that accumulated upon PPARγ overexpression as a positive control. The experiment was performed at least three times. D, the ceramide content of siFam57b-A treated ST2 cells was examined in a similar manner with or without 20 μm FB1, a ceramide synthase inhibitor, which was added from day 5 to 6 of differentiation. The ceramide levels were measured 6 days after differentiation using 100 μg of protein. The relative ceramide levels between siNC and siFam57b are shown for both conditions with and without FB1. E, ST2 cells were treated with siRNA (siNC and siFam57b-A, -B, and -C) and induced to undergo adipogenesis. On day 6, total RNA was extracted and analyzed by qRT-PCR. The mRNA expression of Cers2, -4, -5, and -6 was measured using the primer sets listed in Table 2. Results are means ± S.D. (error bars) for three individual experiments. *, p < 0.05; **, p < 0.01; ***, p < 0.001.

