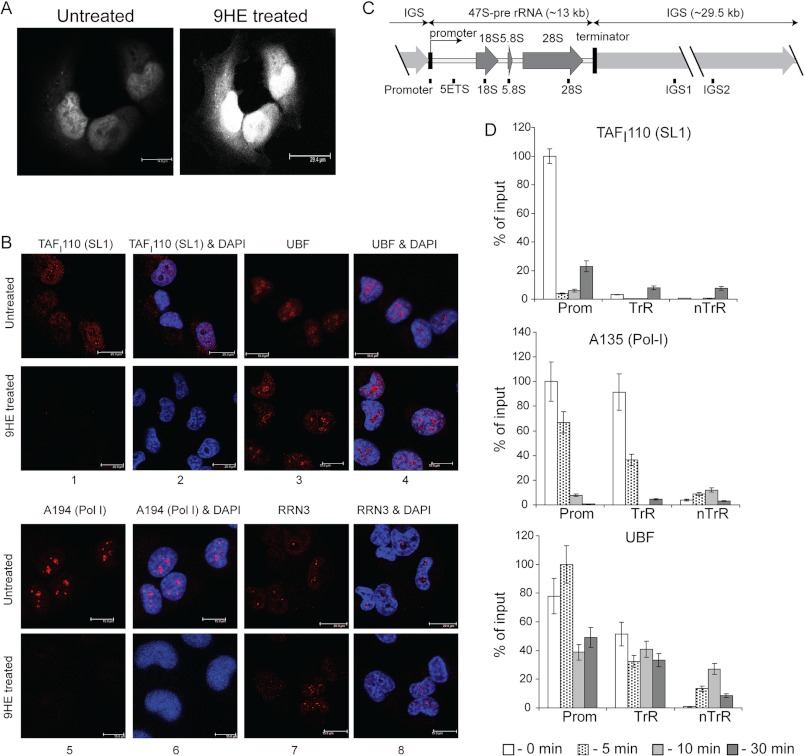
FIGURE 6.
9HE rapidly localizes in the nucleus and affects localization and occupancy of various components of the Pol-I transcription apparatus. A, actively growing U2OS cells (confluency ∼70%) were either treated with 10 μm 9HE for 10 min or untreated, fixed, washed, and visualized using a Leica TCS SP5 scanning laser confocal microscope. B, actively growing U2OS cells (confluency ∼70%) were either treated with 5 μm 9HE for 10 min or untreated, fixed, and analyzed by indirect immunofluorescence using antibodies specific to human SL1 subunit TAFI110 (panels 1 and 2), human UBF (panels 3 and 4), human Pol-I largest subunit A194 (panels 5 and 6), and human Pol-I transcription factor RRN3 (panels 7 and 8). Nuclear DNA was stained by DAPI (blue). Images were obtained by laser scanning confocal microscopy (scale bar is 15 μm). C, a diagram of the human rDNA repeat is shown indicating the positions of the PCR primer/probes used in ChIP analysis. The primer and probe sets used in the quantitative real-time PCR for the rDNA repeat were from the following regions: the rDNA promoter, 5′ETS, 18 S, 5.8 S, and 28 S rRNA gene-transcribed sequences (included in the 47 S pre-rRNA) and the intergenic spacers IGS1 and IGS2. kb, kilobases. D, ChIP assays were performed on chromatin from cells treated with 5 μm 9HE for the indicated periods of time using antibodies specific to human SL1 subunit TAFI110, human Pol-I second largest subunit A135, and human UBF and normalized to control IgG samples. The signal representing the transcribed region (TrR) is the average of the combined signal from 5′ETS, 18 S, 5.8 S, and 28 S rRNA. The signal representing the non-transcribed region (nTrR) is average of the combined signal from IGS1 and IGS2. Prom, a promoter region. Bar graphs are the combined data of three independent ChIP experiments. S.D. is shown.

