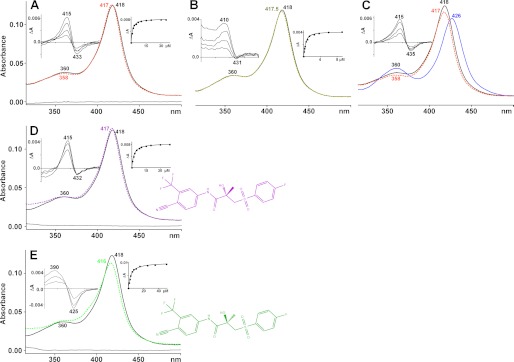
FIGURE 1.

Absolute and difference (left side insets) spectra of CYP46A1 in the absence (black line) and presence (dashed colored lines) of different ligands. Right side insets show the fitting of the binding curves. Shown are P450 spectra with racBIC (orange dashed line, A), 24S-hydroxycholesterol (olive dashed line, B), imidazole (solid blue line) and racBIC (orange dashed line) (C), S-BIC (dashed purple line, D), and R-BIC (dashed green line, E). The concentration of CYP46A1 is 1 μm, and that of the ligand is 20 μm. The gray solid lines are the absorbance of BIC. Chemical structures of S-BIC (in purple) and R-BIC (in green) are also shown.
