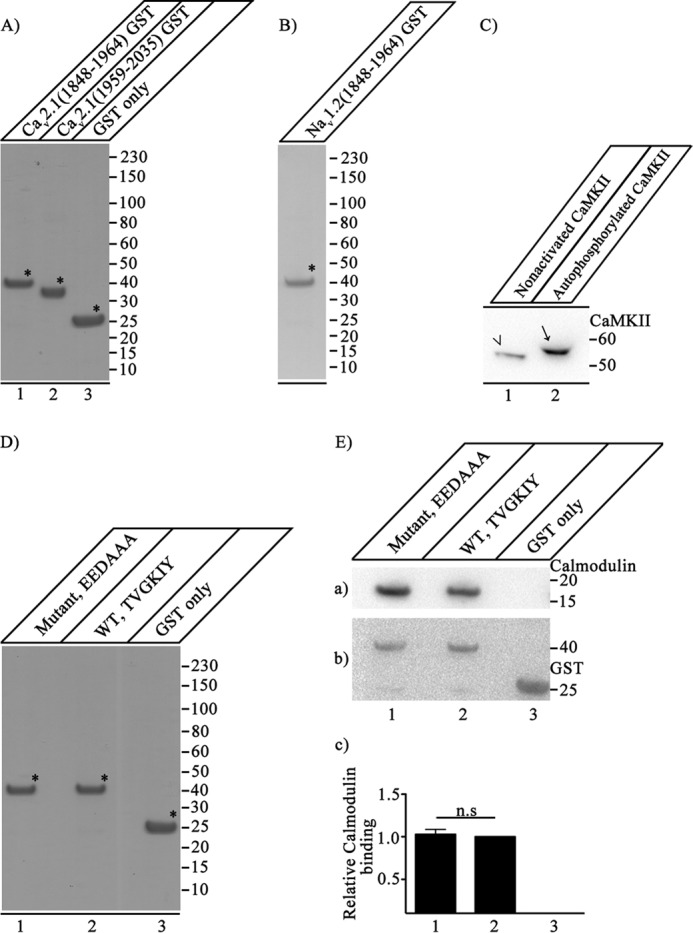
FIGURE 1.

Expression, purification, and function of CaV2.1 and NaV1.2 proteins. A, CaV2.1(1848–1964)-GST (lane 1), CaV2.1(1959–2035)-GST (lane 2), and GST (lane 3) were expressed and purified as described under “Experimental Procedures.” Samples (7.5 μg of purified protein) were denatured, loaded, and resolved on 10% SDS-PAGE. The gel was stained with Coomassie Brilliant Blue to show the purity of the expressed proteins, which were used for in vitro binding assays. B, expression and purification of NaV1.2(1848–1964)-GST. NaV1.2(1848–1964)-GST was expressed and purified as described under “Experimental Procedures.” Samples (7.5 μg of purified protein) were denatured, loaded, and resolved on 10% SDS-PAGE. The gel was stained with Coomassie Brilliant Blue to show the quality of the expressed proteins. C, extent of CaMKII phosphorylation. Nonactivated CaMKII was analyzed side by side with autophosphorylated CaMKII to estimate the extent of CaMKII autophosphorylation by comparison of their migration positions in SDS-PAGE. Autophosphorylation of CaMKII causes an upward shift in the migration of CaMKII (lane 2, arrow) as compared with the nonactivated CaMKII (lane 1, arrowhead) when separated on 4–20% SDS-PAGE. The blot was developed using anti-CaMKII that detects both nonactivated and autophosphorylated CaMKII. Lack of any band corresponding to the nonactivated CaMKII in lane 2 (compared with lane 1) suggests that CaMKII is autophosphorylated to near completion under our experimental conditions. D, CaV2.1(1848–1964)-EEDAAA-GST (lane 1), CaV2.1(1848–1964)-GST (lane 2), and GST (lane 3) were expressed and purified as described under “Experimental Procedures.” Samples (7.5 μg of purified protein) were denatured, loaded, and resolved on 10% SDS-PAGE. The gel was stained with Coomassie Brilliant Blue to show the purity of the expressed proteins, which were used for in vitro binding assays. E, binding of CaV2.1(1848–1964)-EEDAAA, CaV2.1(1848–1964)-GST, and GST alone to CaM. a, the blot was probed with anti-CaM. b, the same blot after stripping and re-probing with anti-GST to show loading of CaV2.1(1848–1964)-EEDAAA (lane 1), CaV2.1(1848–1964)-GST (lane 2), and GST (lane 3). c, quantitation of relative CaM binding under the indicated conditions (mean ± S.E.; n.s., not significant by Student's t test; n = 5). Asterisks mark the primary protein band corresponding to the expressed protein of interest in panels A, B, and D.
