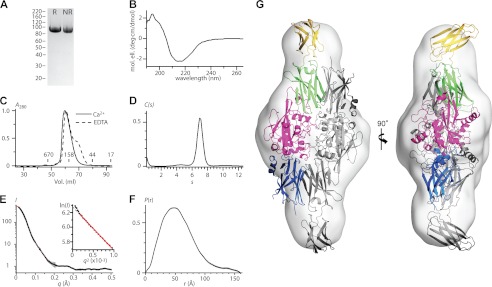
FIGURE 2.

Structure of AgTG3 in solution. A, reducing (R) and nonreducing (NR) SDS-PAGE of purified AgTG3. B, CD spectrum. C, SEC in presence of Ca2+ (solid line) and EDTA (dashed line). Retention volume of molecular mass standards is indicated. D, sedimentation velocity C(s) distribution for Ca2+-AgTG3, s20,w = 7.0 (f/f0 = 1.4). E–H, Ca2+-AgTG3 SAXS analysis. E, I versus q (black line) fit by p(r) distribution (red line) (inset) Guinier plot fit to RG = 42.7 Å (limit qRG = 1.35). F, p(r) distribution, Dmax = 160 Å. G, superposition of ab initio volume with P2 symmetry to Ca2+-AgTG3 homology model. One monomer of the dimer is colored according to protein domains shown in Fig. 1A.
