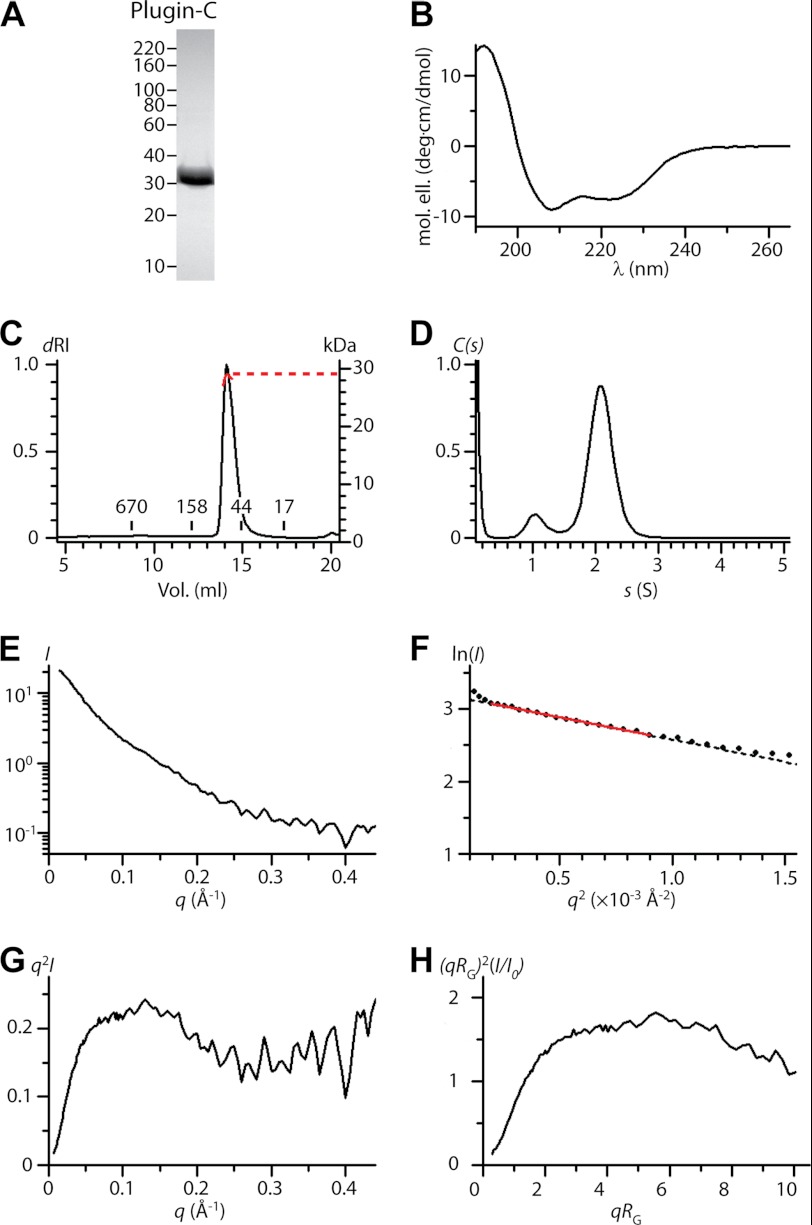
FIGURE 3.
Structure of Plugin in solution. A, SDS-PAGE of purified Plugin-C. B, CD spectrum. C, SEC-MALLS, concentration (dRI, black line) and calculated molecular mass from static light scattering (red line). Retention volume of molecular mass is standards indicated. D, sedimentation velocity C(s) distribution, s20,w = 2.1, (f/f0 = 1.4). E–H, Plugin-C SAXS analysis. E, I versus q curve. F, Guinier plot fit to RG = 42.8 Å (limit qRG = 1.33). G, absolute and H, dimensionless Kratky plot for Plugin-C.

