
FIGURE 1.
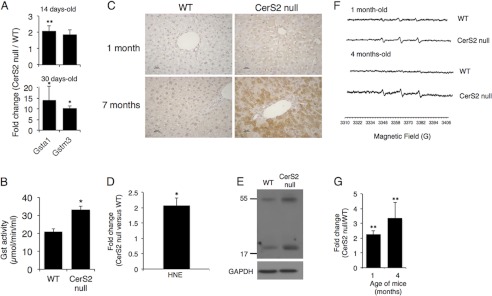
Oxidative stress markers in CerS2 null mouse. A, quantitative real-time-PCR analysis of Gst isozymes in liver is shown. Results are fold-change of mRNA levels of CerS2 null mice versus WT at the indicated ages. Values are the means ± S.D., n = 3. *, p < 0.05; **, p < 0.01. B, Gst activity in 1-month-old mouse liver is shown. Values are the means ± S.D., n = 3. *, p < 0.05. C, immunohistochemical staining of 4-HNE is shown. Scale bar = 25 μm. D, shown are 4-HNE levels in 4 month-old mice liver. Values are the means ± S.D., n = 3. *, p < 0.05. E, shown is a Western blot of nitrotyrosine in livers of 4-month-old mice liver. GAPDH was used as loading control. Results are from a typical experiments repeated three times. F, shown are representative ESR spectra of 4-phosphono-oxy-2,2,6,6-tetramethyl-piperidine-N-hydroxyl-radical adducts in the blood of 1-month- and 4-month-old mice. G, shown is quantification of amplitude intensity (n = 2 for 1-month-old and n = 2 for 4-month-old). *, p < 0.01.