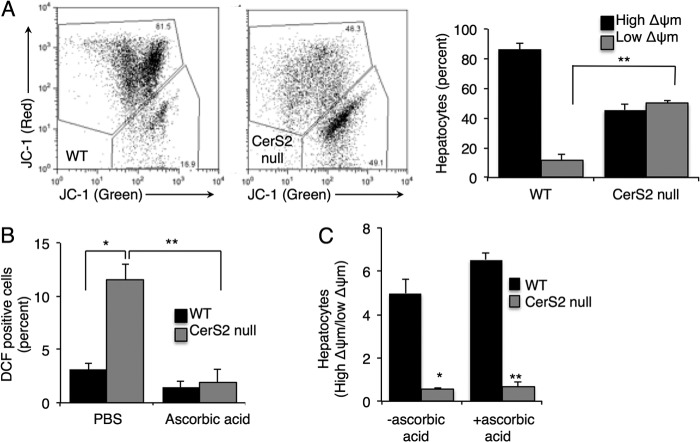
FIGURE 5.
Mitochondrial membrane potential in hepatocytes. A, shown is a representative FACS analysis of mitochondrial membrane potential estimated using JC-1. The percent of hepatocytes with low ΔΨm was calculated from the lower gate. n = 4. B, shown are ROS levels after PBS or ascorbic acid treatment. C, mitochondrial membrane potential after ascorbic acid treatment is shown. Values are the means ± S.E., n = 3–6. *, p < 0.01; **, p < 0.001.

