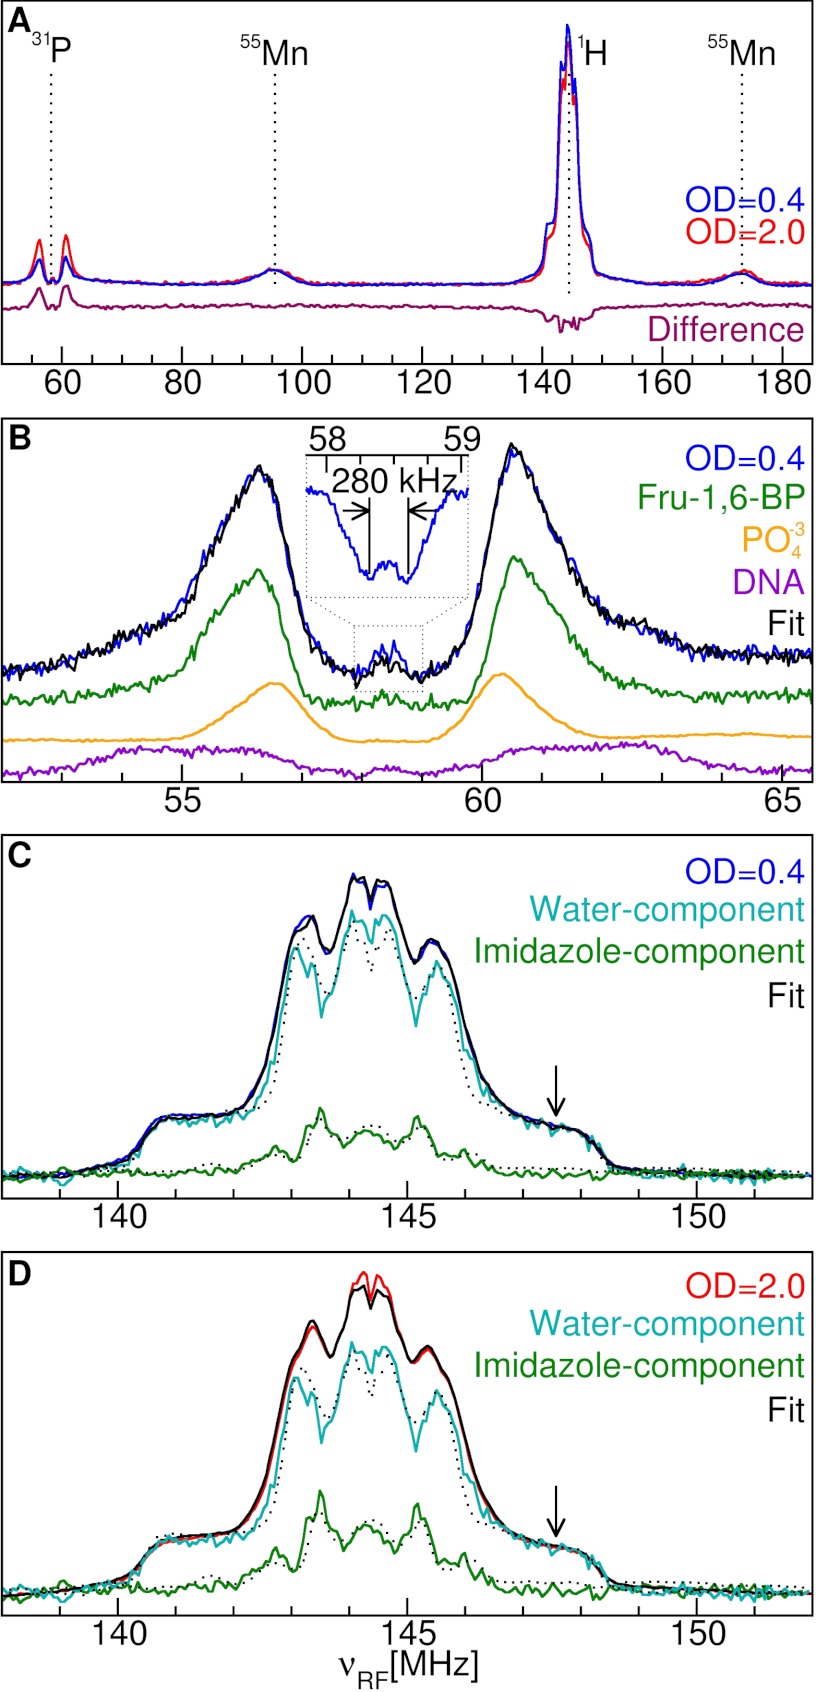
FIGURE 1.
95-GHz Mn(II) ENDOR spectra of D. radiodurans. A, the broadband spectra of intact cells from cultures grown to OD = 0.4 and 2.0 and their difference spectrum. The labels indicate the resonance position of the detected nuclei. B, the 31P region of OD = 0.4 cells and its least squares fit composed of the frozen solution spectra of 50 μm Mn(II): in 100 mm Fru-1,6-BP (52%, green); in 10 mm orthophosphate (20%, orange); and with DNA (24%, purple). The OD = 0.4 sample Mims ENDOR spectrum of the small 280-kHz resonance is shown in the inset. C and D, the 1H regions and their decomposition into their respective water and imidazole components as compared with those of 50 μm Mn(II) by itself ([Mn(H2O)6]2+) (dotted trace over the water component) and in 500 mm imidazole ([Mn(imidazole)n]2+) (dotted trace over the imidazole component). The arrow indicates the region used to quantitate the number of water ligands.

