
FIGURE 3.
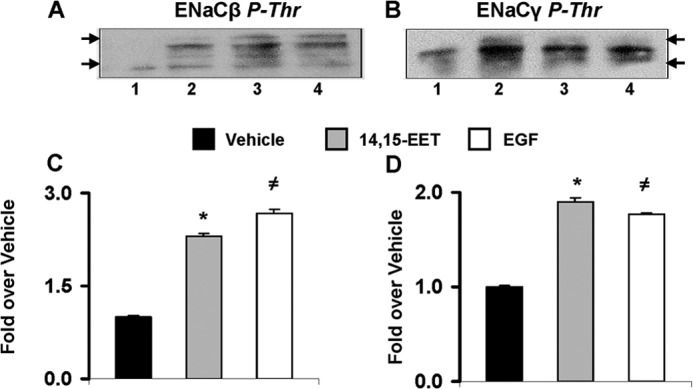
EGF and EETs stimulate threonine phosphorylation of ENaCβ and -γ. A and B, equivalent volumes of lysates from cells (at 80–85% confluence) treated for 15 min with vehicle, 11,12-EET (10 μm), 14,15-EET (5 μm), or EGF (lanes 1, 2, 3, and 4, respectively) (10 ng of protein/lane) were exposed to anti-phosphothreonine (P-Thr) antibodies, and after protein G affinity purification, the anti-phosphothreonine immunoreactive proteins were analyzed by Western blot using anti-ENaCβ (A) or -ENaCγ (B) antibodies. Arrows show mobilities for 75- and 125-kDa proteins. C and D, lysates from 32P-labeled cells incubated for 15 min with vehicle, 14,15-EET (5 μm), or EGF (10 ng/ml) (black, gray, and white bars, respectively) were exposed to anti-ENaCβ (C) or -ENaCγ (D) antibodies, and the 32P contents of affinity-purified immunoreactive proteins were determined by β-counting. Values are averages ± S.E. (error bars) calculated from two different experiments, each done in duplicates. C, different from vehicle: *, p < 0.001; ≠, p < 0.0003. D, different from vehicle: *, p < 0.0004; ≠, p < 0.0004.