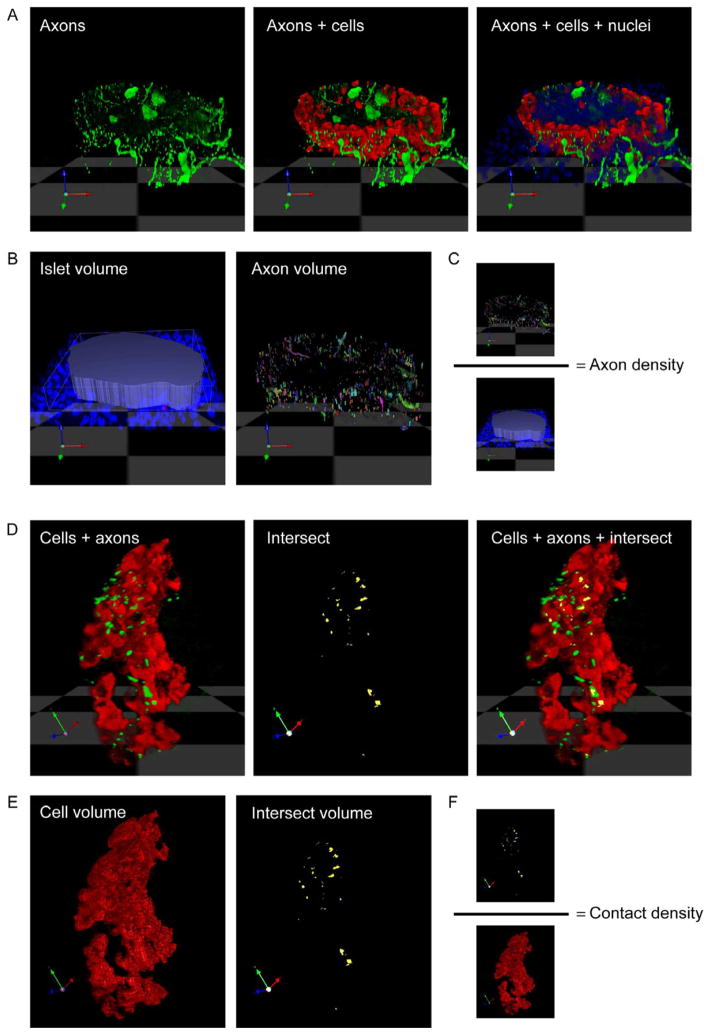
Figure 3.
Representation of axon density and contact density quantification. (A) Three dimensional rendering of a z-stack of confocal images (n = 40) of a mouse pancreatic section stained for TH (green), glucagon (red), and DAPI (blue). (B) Islet volume (in voxels) is determined by outlining the islet using DAPI staining. The volume of axonal staining is determined within this islet volume. (C) The axon (innervation) density is calculated as the quotient axon volume/ islet volume. (D) TH-labeled axons can be seen in close proximity to glucagon-labeled alpha cells. Shown is a higher magnification and rotated image of the islet in A. The proximity of axons to target cells can be detected using an algorithm in Volocity software (“intersect). Intersect between axons and cells is shown in yellow. Notice that few axonal varicosities contact target cells (yellow and green overlap in the merged image on the right). (E) Cellular (cell) volume is determined based on cell immunostaining, intersect volume is determined as the close proximity or overlap of axon and cell immunostaining. (F) The contact density is calculated as the quotient intersect volume/ cellular volume.

