
Fig. 1.
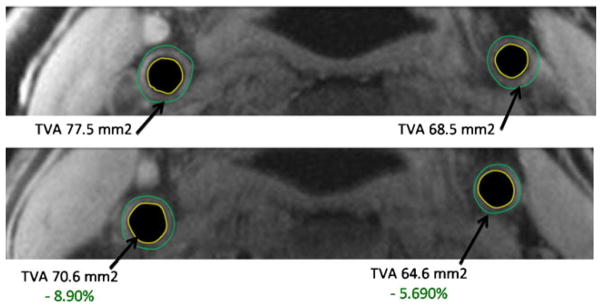
Sample MRI images from a patient at baseline top) and treated with dalcetrapib 600 mg for 24 months (bottom) showing regression in total vessel area (top panel). The MRI metrics used as endpoints are shown in the bottom panel. LCC = left carotid artery. RCC = right carotid artery. Wall outer boundary is denoted in green. Wall inner boundary is denoted in yellow. Total vessel area is lumen area + wall area. Normalized wall index is wall area divided by total vessel area and represents a ratio with no units