
Figure 2.
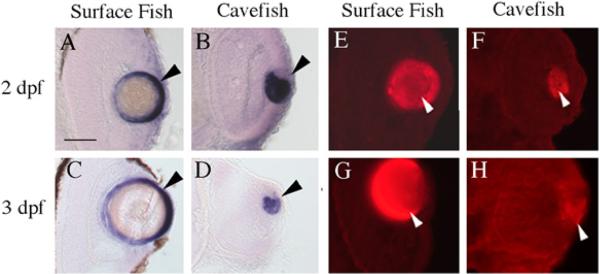
Gamma crystallin mRNA and protein expression. Surface fish. (A, C, E, G) Cavefish (B, D, F, H). Sections showing gamma-M crystallin mRNA expression in the surface fish and cavefish lens determined by whole mount in situ hybridization at 2 (A, B) and 3-days post-fertilization (dpf) (C, D). (E–H) Sections showing gamma crystallin protein expression in the surface fish and cavefish lens (arrowheads) determined by anti body staining at 2 (E, F) and 3 dpf (G, H). Scale bar in A is 50 μ; magnification is the same in each frame. A–D after Strickler et al. (2007b).