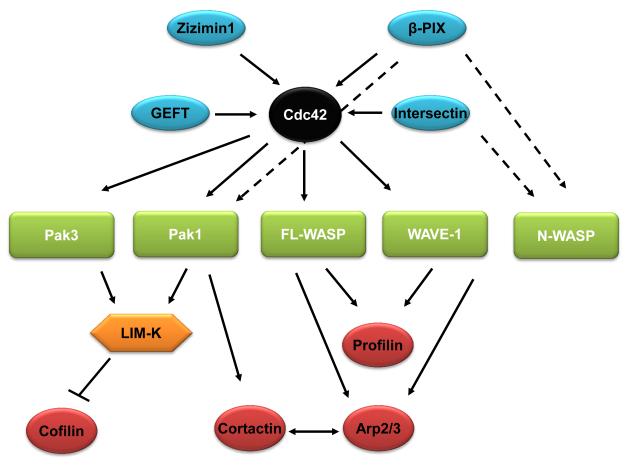
Figure 2. The cdc42-actin regulatory network.
The upstream and downstream regulators of cdc42 network are illustrated. Cdc42 GEFs are shown in blue, and direct cdc42 effectors are in green. Actin-binding proteins are shown in red. LIM-K is neither a direct Rac1 effector nor an actin-binding protein in this network. Solid arrows indicate pathways that follow the typical GEF-small GTPase-small GTPase effector-actin binding protein hierarchy, while dashed arrows indicate pathways that violate this hierarchy.

