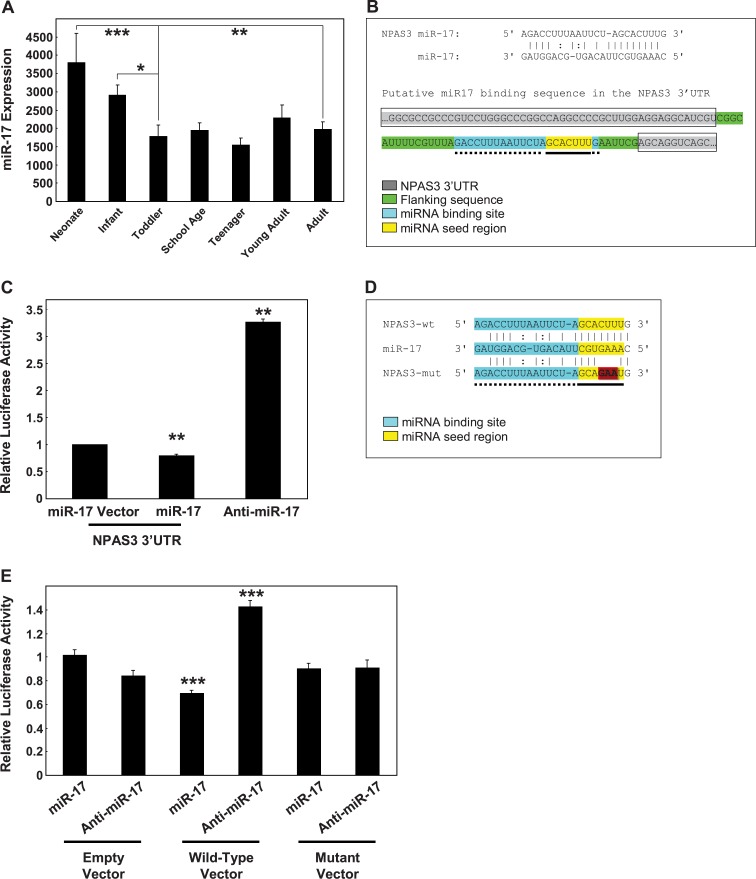
Fig. 3.
miR-17 expression in the dorsolateral prefrontal cortex across development. (A) MiR-17 expression was measured by gene microarray for the 7 developmental groups. Data is expressed as miR-17 expression normalized to the geometric mean of small nucleolar RNAs and is presented as mean + SEM. *P < .05, **P < .005, ***P < .0005. (B) Identification of a putative miR-17 binding sequence in the NPAS3 3′UTR. The binding site was identified using PicTar and confirmed using TargetScan. The NPAS3 3′UTR is shaded gray and boxed and includes the sequences between the gray. The putative miR-17 binding site is highlighted blue with dotted underline and the seed region within the binding site is indicated in yellow with solid underline. Sequences flanking the putative miR-17 binding site are highlighted green (no underline or boxing). (C) SHSY5Y cells were transfected with empty vector (luciferase construct) or a luciferase construct containing the NPAS3 3′UTR in combination with miR-17, anti-miR-17, or scrambled controls. Data representative of n = 3 independent experiments from three replicate cultures. **P = .01. (D) A mutant version of the NPAS3 microRNA (miRNA) binding sequence that has base changes (indicated by highlighted [red and bold] bases) introduced to the miRNA seed-pairing region. (E) HEK293 cells were cotransfected with empty vector, wild-type, or mutated miRNA binding sequence in combination with miR-17, anti-miR-17, or scrambled controls. Data representative of n = 4 independent experiments from four replicate cultures are normalized to the respective empty vector controls and expressed as relative luciferase activity. ***P < .001. This figure can be seen in color at Schizophrenia Bulletin online.

