
Fig. 4.
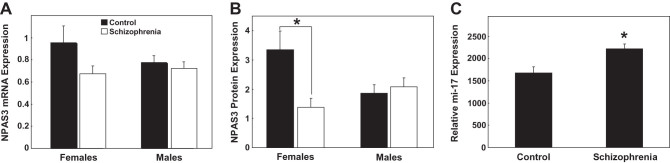
NPAS3 mRNA (messenger RNA) and protein expression in the dorsolateral prefrontal cortex of people with schizophrenia. (A) NPAS3 mRNA expression was measured by quantitative real-time PCR (qPCR) and (B) NPAS3 protein expression was measured by Western blotting. For NPAS3 mRNA and protein, expression was grouped based on gender (females and males) and diagnosis (control [black] and schizophrenia [white]). NPAS3 mRNA expression was normalized to the geometric mean of the housekeeping genes and presented as mean + SEM. NPAS3 protein expression was normalized to β-actin and presented as mean + SEM. *P < .05. (C) miR-17 expression was measured by qPCR. Expression was grouped based on diagnosis. Data is expressed as miR-17 normalized to the geometric mean of small nucleolar RNAs and presented as mean + SEM. *P < .05.