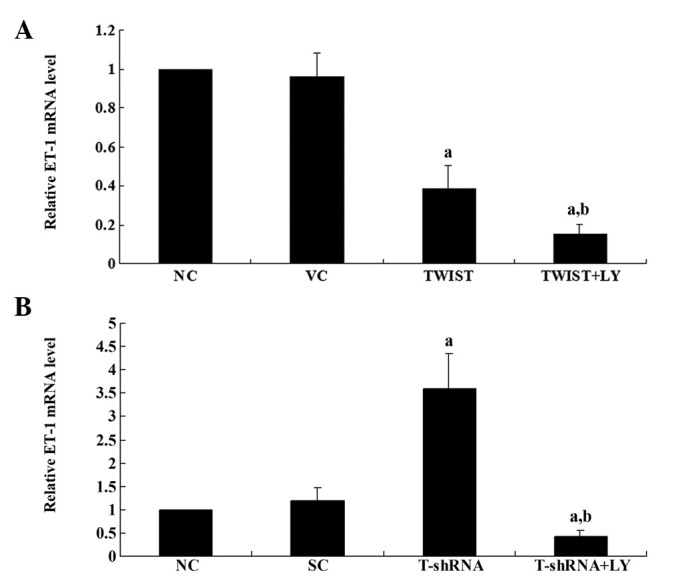
Figure 2.

The level of endothelin-1 (ET-1) mRNA in Saos-2 and MG-63 cells (A). The ET-1 mRNA level in normal control cells (NC), cells stably transfected with empty pcDNA3 vector (VC) and cells stably transfected with pcDNA3-TWIST expression vector (TWIST) with or without LY294002 (LY; 50 mM) treatment was analyzed with real-time reverse transcription (RT)-PCR in Saos-2 cells. (B) The ET-1 mRNA level in NC, cells stably transduced with scrambled control short hairpin RNA (shRNA) (SC) and cells stably transduced with TWIST-shRNA (T-shRNA) with or without LY (50 μM) treatment was analyzed with real-time RT-PCR in MG-63 cells. The ET-1 mRNA level is presented as the fold change relative to that of the NC (designated as 1). aP<0.05 compared with NC and VC (A) or SC (B); bP<0.05 compared with TWIST (A) or T-shRNA (B).
