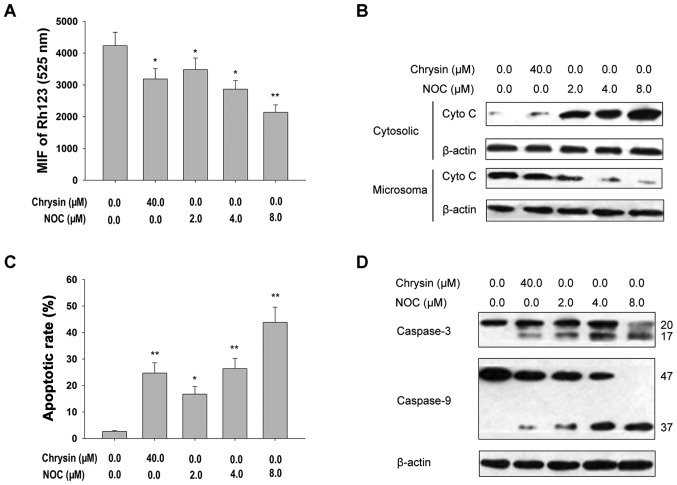
Figure 1.
Effects of NOC on mitochondrial apoptotic events in MDA-MB-453 cells. (A) MDA-MB-453 cells were treated with the indicated concentrations of NOC or chrysin for 24 h. The mean fluorescence intensity of Rh123 was measured by FCM. Data shown are means ± SD (n=3). *P<0.05; **P<0.01 vs. 0.1% DMSO. (B) Cell treatment was the same as in (A). Cytochrome c was examined using western blotting in mitochondrial and cytoplasmic lysates and β-actin was used as the loading control. (C) Cell treatment was the same as in (A). Caspase-3 and -9 expression was determined by western blotting of the total cell lysates and β-actin was used as the loading control. (D) Cell treatment was the same as in (A). The apoptotic rate was analyzed by FCM using PI staining. Data shown are means ± SD (n=3). *P<0.05; **P<0.01 vs. 0.1% DMSO. NOC, 5,7-dihydroxy-8-nitrochrysin; FCM, flow cytometry; SD, standard deviation; DMSO, dimethyl sulfoxide; PI, propidium iodide.

