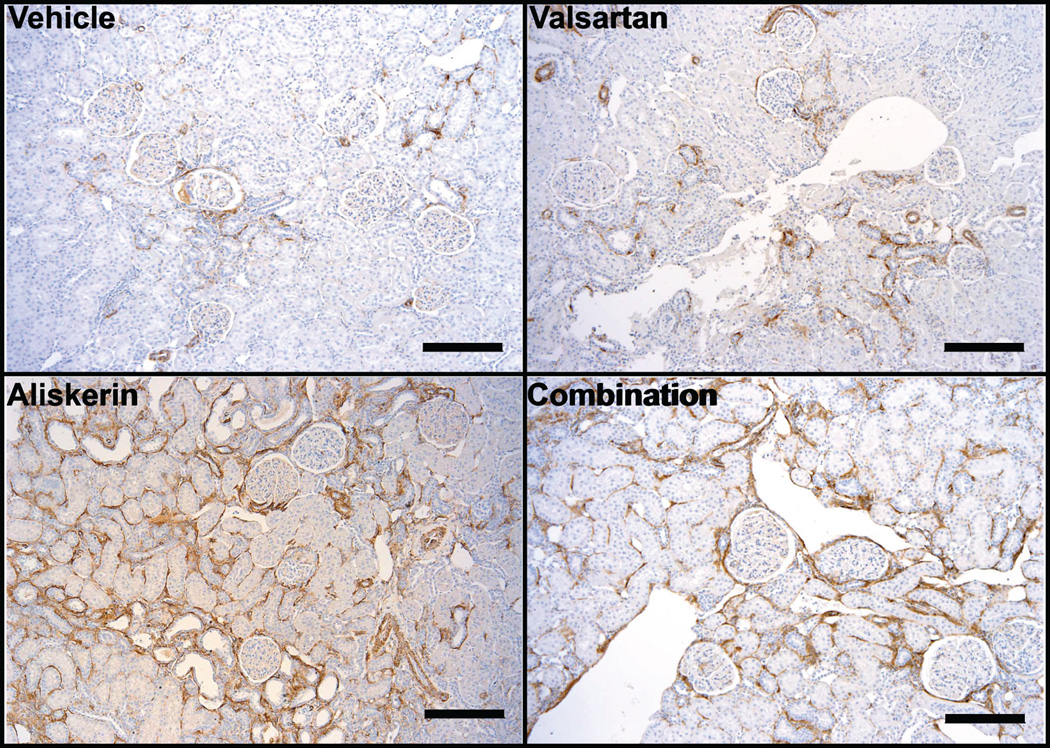
Figure 5.
Immunohistochemical staining for α-SMA (brown) on kidneys sections obtained from vehicle, valsartan, aliskiren, and combination-treated mRen2.Lewis hypertensive rats. Kidneys from vehicle treated mRen2.Lewis rats showed the expected α-SMA expression in the mural cells of the vasculature and occasionally in the peritubular interstitium whereas in the treated groups there was an increase in the expression of α-SMA in the interstitium (peritubular and periglomerular) indicating the activation of myofibroblasts leading to fibrosis. Remarkably, the increase in interstitial expression of α-SMA was more significant in the aliskiren and combined therapy groups. Scale bar: 200 µm.

