
Figure 3.
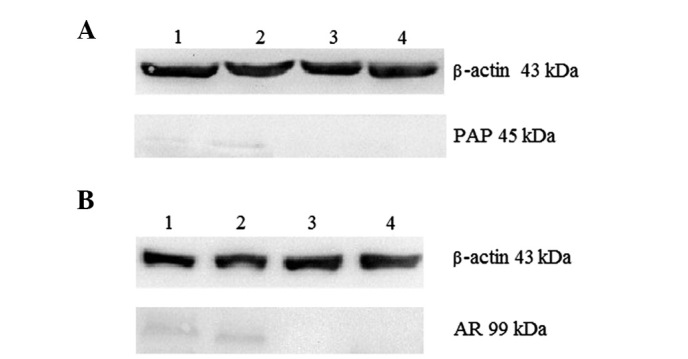
Western blot analysis of PAP (A) and AR (B). 1, spheres induced by TGF-β; 2, cells with the CD133+/CD44+ phenotype induced by TGF-β; 3, spheres and 4, cells with the CD133+/CD44+ phenotype.
Official websites use .gov
A
.gov website belongs to an official
government organization in the United States.
Secure .gov websites use HTTPS
A lock (
) or https:// means you've safely
connected to the .gov website. Share sensitive
information only on official, secure websites.
Western blot analysis of PAP (A) and AR (B). 1, spheres induced by TGF-β; 2, cells with the CD133+/CD44+ phenotype induced by TGF-β; 3, spheres and 4, cells with the CD133+/CD44+ phenotype.