Figure 4.

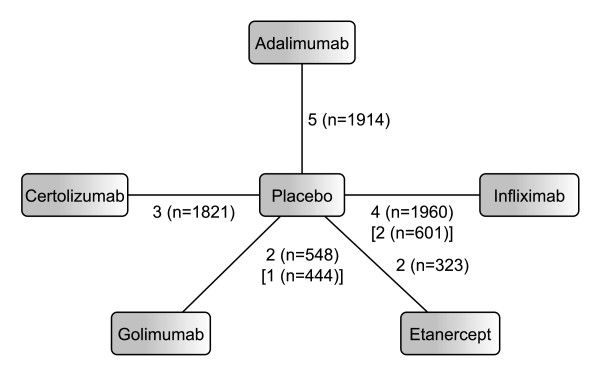
Network diagram for RA analysis. Edges are labelled with the number of studies and the total number of patients included in these studies. Numbers in square brackets refer to HAQ evidences where this differs from ACR evidence.

Network diagram for RA analysis. Edges are labelled with the number of studies and the total number of patients included in these studies. Numbers in square brackets refer to HAQ evidences where this differs from ACR evidence.