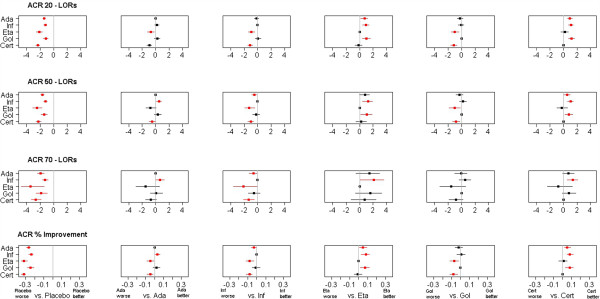
Figure 6.

Forest Plot of ACR results. Plots pairwise LORs for ACR 20, ACR 50 and ACR 70 outcome and improvement differences for ACRcont of anti-TNF agents against placebo and one another. Red colour indicates significant differences at the 80% level.
