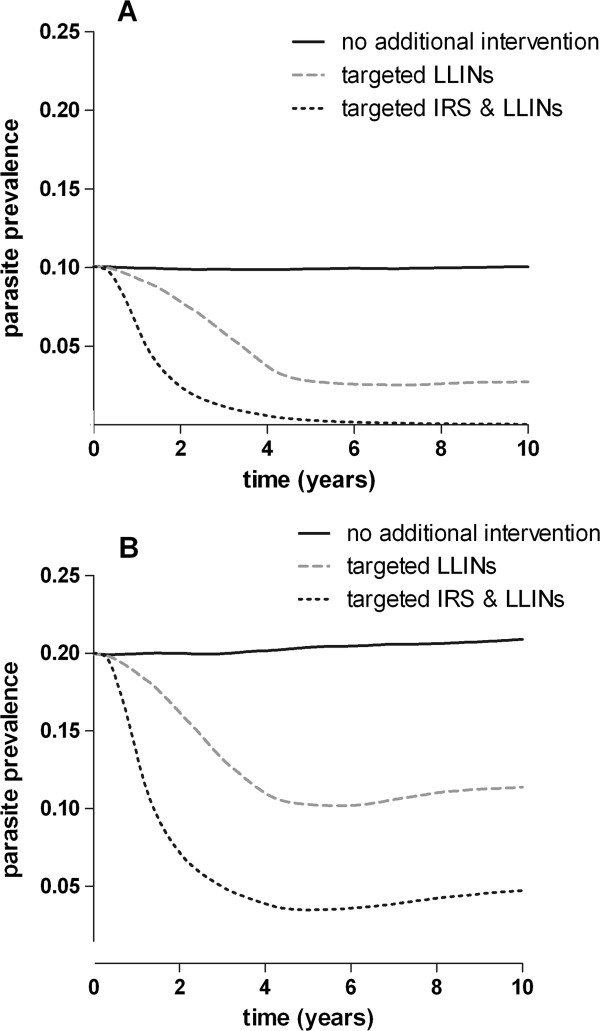
Figure 2.
Simulation of intervention outcome. The figure presents a simulation of hotspot-targeted interventions in areas with a baseline parasite prevalence of 10% or 20%. ITN coverage is assumed to be 41% across all age groups (83% in under-fives). Plotted is smoothed parasite prevalence in the total population as a function of time in years since the start of the intervention. No interventions (solid black line), hotspot-targeted increase in LLIN coverage to reach 90% effective coverage in hotspots (dashed grey line) and hotspot-targeted increase in LLIN coverage to reach 90% effective coverage in hotspots in combination with targeted IRS reaching 90% of households in hotspots (dashed black line).

