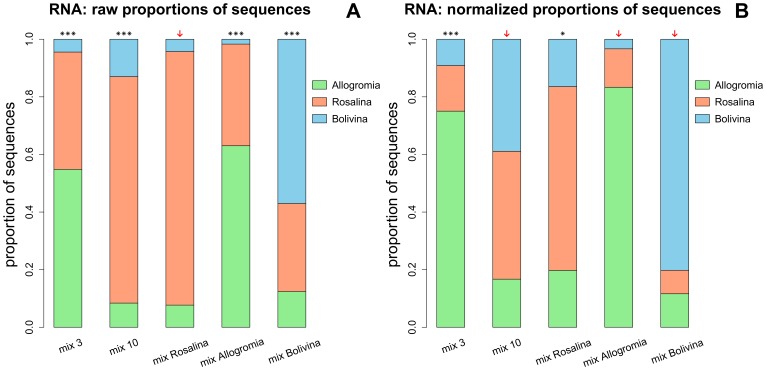
Figure 4. Proportions of cDNA sequences of Allogromia, Rosalina, and Bolivina found in the five mock communities.
(A) Observed proportions of cDNA sequences without normalization; (B) Observed proportions of cDNA sequences after normalization with the ELF (Expression Level Factor, see text for details). Raw and normalized proportions were used for Chi2 goodness of fit test (df = 2; α = 0.05). ***: significant at 0.001; **: significant at 0.01; *: significant at 0.05; arrow: not significant, meaning that observed proportions did not differ significantly from expected proportions. Mix 3 - with three cells of each species; mix 10 - with ten cells of each species; mix Allogromia – with thirty cells of Allogromia and three cells of Rosalina and Bolivina; mix Rosalina – with thirty cells of Rosalina and three cells of Allogromia and Bolivina; mix Bolivina – with thirty cells of Bolivina and three cells of Allogromia and Rosalina.

