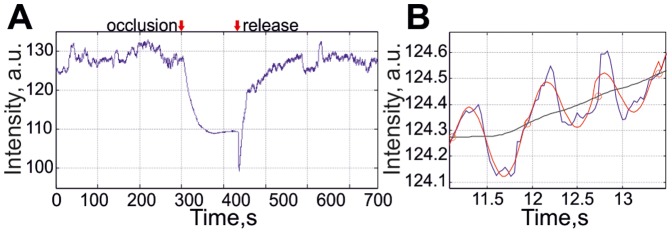
Figure 2. Time traces of raw PPG signal within the palm area.

(A) An example of the signal during the complete occlusion test (about 12 min). (B) Zoomed part of the signal (blue line) with the temporal boundaries of each cardiac cycle (shown by red circles), which has been approximated to the harmonic reference signal (red dotted line). The black line in the part (B) is the raw PPG signal filtered by continuous averaging of the data over 30 frames.
