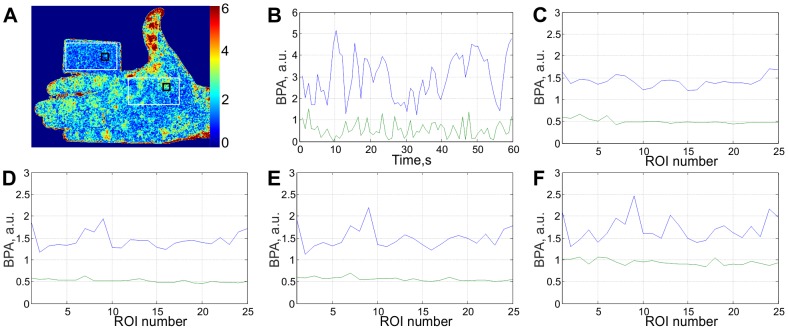
Figure 3. Estimation of the signal-to-noise ratio.
(A) An example of 2D map of the blood pulsation amplitude for subject's arm and the cardboard; (B) Time-traces of the BPA averaged within 15×15 pixels regions shown by black rectangles in (A): the blue line for the arm and the green line for the cardboard; (C – F) Time-averaged BPA from randomly chosen regions within white rectangles sizing 30×30 (C), 15×15 (D), 8×8 (E) pixels, and for single pixel (F).

