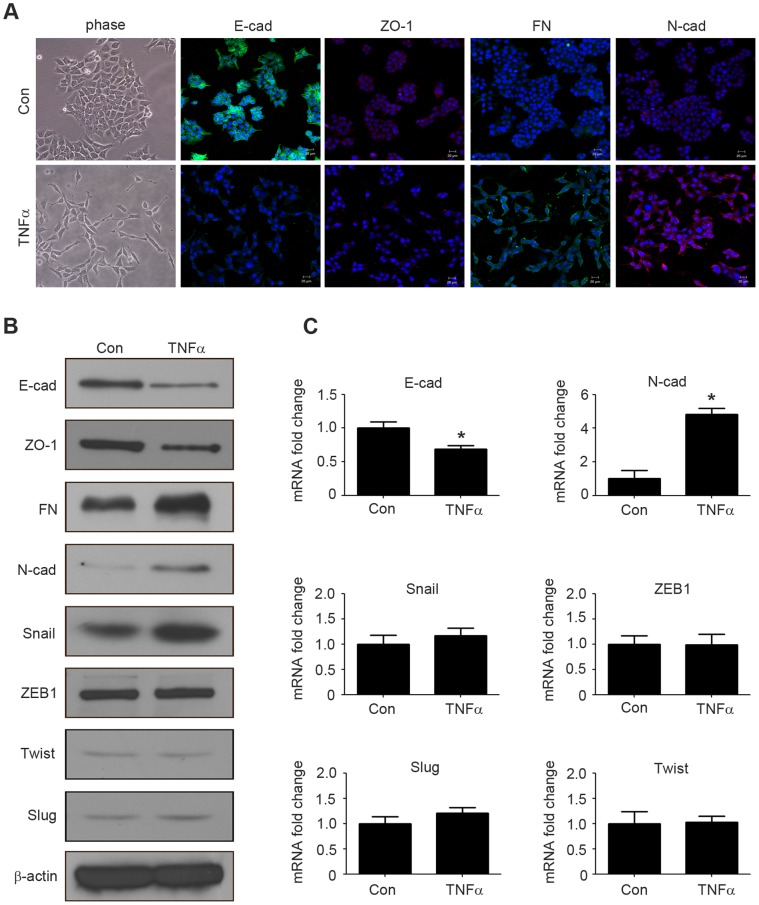
Figure 2. TNFα treatment triggers EMT in HCT116 cells.
(A) HCT116 cells were treated with or without TNFα (20 ng/ml) for 4 days. Cell morphological changes associated with EMT are shown in the phase contrast image. Expression of E-cadherin, ZO-1, fibronectin, N-cadherin were analyzed by immunofluorescence staining. Nuclei were visualized with DAPI staining. Scale bars: 20 µm. (B) HCT116 cells were treated with or without TNFα (20 ng/ml) for 4 days, and the expression of E-cadherin, ZO-1, fibronectin, N-cadherin, Snail, ZEB1, Twist, Slug were analyzed by western blotting. β-actin servers as the loading control. (C) HCT116 cells were treated with or without TNFα (20 ng/ml) for 4 days. The mRNA levels of E-cadherin, N-cadherin, Snail, ZEB1, Twist, Slug were analyzed by qRT-PCR. *p<0.05 compared with control.

